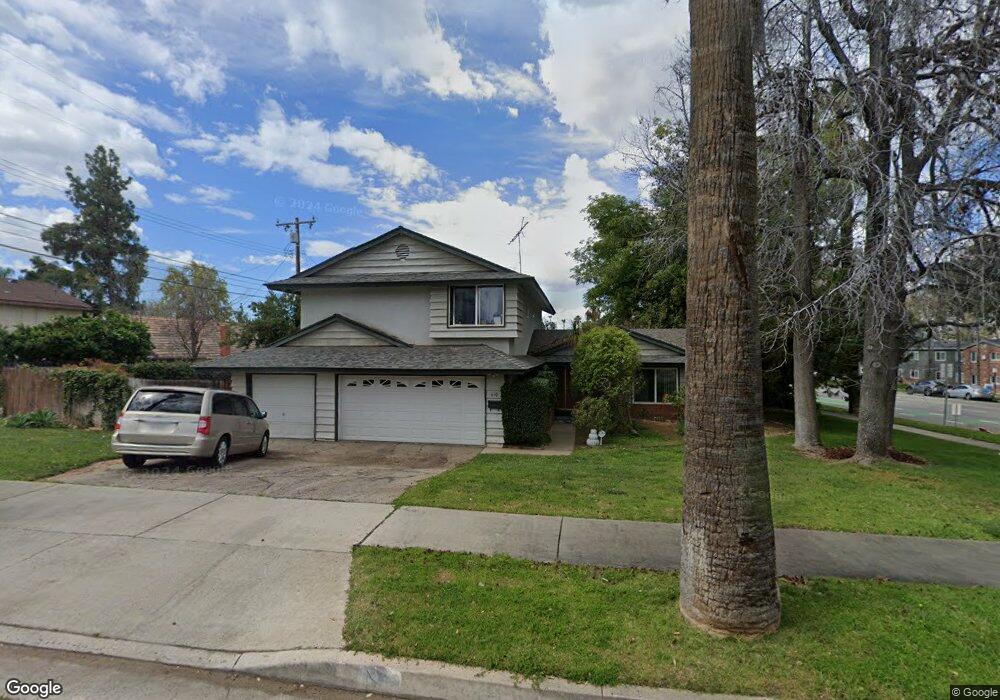
610 S Grove St Redlands, CA 92374
South Redlands NeighborhoodEstimated Value: $624,241 - $703,000
5
Beds
3
Baths
2,046
Sq Ft
$328/Sq Ft
Est. Value
About This Home
This home is located at 610 S Grove St, Redlands, CA 92374 and is currently estimated at $671,310, approximately $328 per square foot. 610 S Grove St is a home located in San Bernardino County with nearby schools including Mariposa Elementary School, Moore Middle School, and Redlands East Valley High School.
Ownership History
Date
Name
Owned For
Owner Type
Purchase Details
Closed on
Feb 22, 2017
Sold by
Thompson Irene Margaret Christine
Bought by
Thompson Irene Margaret Christine and Dangl Jaqueline Cynthia
Current Estimated Value
Purchase Details
Closed on
Jan 25, 1995
Sold by
Veldman Martha J
Bought by
Veldman Martha Josephine and The Martha J Veldman Living Tr
Create a Home Valuation Report for This Property
The Home Valuation Report is an in-depth analysis detailing your home's value as well as a comparison with similar homes in the area
Home Values in the Area
Average Home Value in this Area
Purchase History
| Date | Buyer | Sale Price | Title Company |
|---|---|---|---|
| Thompson Irene Margaret Christine | -- | None Available | |
| Veldman Martha Josephine | -- | -- |
Source: Public Records
Tax History Compared to Growth
Tax History
| Year | Tax Paid | Tax Assessment Tax Assessment Total Assessment is a certain percentage of the fair market value that is determined by local assessors to be the total taxable value of land and additions on the property. | Land | Improvement |
|---|---|---|---|---|
| 2025 | $1,415 | $118,921 | $27,174 | $91,747 |
| 2024 | $1,415 | $116,589 | $26,641 | $89,948 |
| 2023 | $1,414 | $114,303 | $26,119 | $88,184 |
| 2022 | $1,394 | $112,062 | $25,607 | $86,455 |
| 2021 | $1,418 | $109,865 | $25,105 | $84,760 |
| 2020 | $1,398 | $108,739 | $24,848 | $83,891 |
| 2019 | $1,360 | $106,607 | $24,361 | $82,246 |
| 2018 | $1,327 | $104,516 | $23,883 | $80,633 |
| 2017 | $1,316 | $102,467 | $23,415 | $79,052 |
| 2016 | $1,214 | $100,458 | $22,956 | $77,502 |
| 2015 | $1,204 | $98,949 | $22,611 | $76,338 |
| 2014 | $1,181 | $97,011 | $22,168 | $74,843 |
Source: Public Records
Map
Nearby Homes
- 743 Mcauliffe Ct
- 110 Judson St
- 455 Judson St
- 1033 Evergreen Ct
- 327 Naomi St
- 1427 Laramie Ave
- 1318 Stillman Ave
- 149 Lido St
- 450 Judson St
- 501 Lemon St
- 1200 E Highland Ave Unit 207
- Belmont Plan at Havenwood
- Camden Plan at Havenwood
- Lexington Plan at Havenwood
- Windsor Plan at Havenwood
- 1432 Moore St
- 1438 Moore St
- 1442 Moore St
- 1446 Moore St
- 909 Stillman Ave
- 1256 E Citrus Ave
- 1261 Morrison Dr
- 0 N Grove St
- 0 N Grove St Unit EV18266238
- 1300 E Citrus Ave
- 1257 Morrison Dr
- 1252 E Citrus Ave
- 1301 Morrison Dr
- 1253 Morrison Dr
- 1248 E Citrus Ave
- 1304 E Citrus Ave
- 1305 Morrison Dr
- 1244 E Cypress Ave
- 700 S Grove St
- 1256 Morrison Dr
- 1308 E Citrus Ave
- 1302 Morrison Dr
- 1309 Morrison Dr
- 1248 Morrison Dr
- 1152 E Cypress Ave