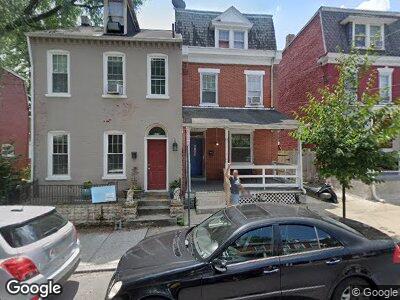
610 S Lime St Lancaster, PA 17602
Stevens NeighborhoodEstimated Value: $145,000 - $275,022
4
Beds
1
Bath
2,550
Sq Ft
$84/Sq Ft
Est. Value
About This Home
This home is located at 610 S Lime St, Lancaster, PA 17602 and is currently estimated at $215,006, approximately $84 per square foot. 610 S Lime St is a home located in Lancaster County with nearby schools including George Washington Elementary School, Jackson Middle School, and McCaskey High School.
Ownership History
Date
Name
Owned For
Owner Type
Purchase Details
Closed on
Feb 19, 2020
Sold by
Black Sean M
Bought by
Fickes David Eugene and Black Sean M
Current Estimated Value
Home Financials for this Owner
Home Financials are based on the most recent Mortgage that was taken out on this home.
Original Mortgage
$73,600
Outstanding Balance
$66,805
Interest Rate
3.6%
Mortgage Type
New Conventional
Purchase Details
Closed on
Sep 28, 2007
Sold by
Arce Benjamin and Arce Karenina
Bought by
Black Sean M
Home Financials for this Owner
Home Financials are based on the most recent Mortgage that was taken out on this home.
Original Mortgage
$75,000
Interest Rate
6.65%
Mortgage Type
Purchase Money Mortgage
Create a Home Valuation Report for This Property
The Home Valuation Report is an in-depth analysis detailing your home's value as well as a comparison with similar homes in the area
Home Values in the Area
Average Home Value in this Area
Purchase History
| Date | Buyer | Sale Price | Title Company |
|---|---|---|---|
| Fickes David Eugene | -- | Members Settlement Solutions |
Source: Public Records
Mortgage History
| Date | Status | Borrower | Loan Amount |
|---|---|---|---|
| Open | Fickes David Eugene | $73,600 | |
| Closed | Black Sean M | $75,000 |
Source: Public Records
Tax History Compared to Growth
Tax History
| Year | Tax Paid | Tax Assessment Tax Assessment Total Assessment is a certain percentage of the fair market value that is determined by local assessors to be the total taxable value of land and additions on the property. | Land | Improvement |
|---|---|---|---|---|
| 2024 | $3,561 | $90,000 | $11,200 | $78,800 |
| 2023 | $3,501 | $90,000 | $11,200 | $78,800 |
| 2022 | $3,356 | $90,000 | $11,200 | $78,800 |
| 2021 | $3,284 | $90,000 | $11,200 | $78,800 |
| 2020 | $3,284 | $90,000 | $11,200 | $78,800 |
| 2019 | $3,234 | $90,000 | $11,200 | $78,800 |
| 2018 | $3,768 | $90,000 | $11,200 | $78,800 |
| 2017 | $1,874 | $40,800 | $9,100 | $31,700 |
| 2016 | $1,857 | $40,800 | $9,100 | $31,700 |
| 2015 | $724 | $40,800 | $9,100 | $31,700 |
| 2014 | $1,193 | $40,800 | $9,100 | $31,700 |
Source: Public Records
Map
Nearby Homes