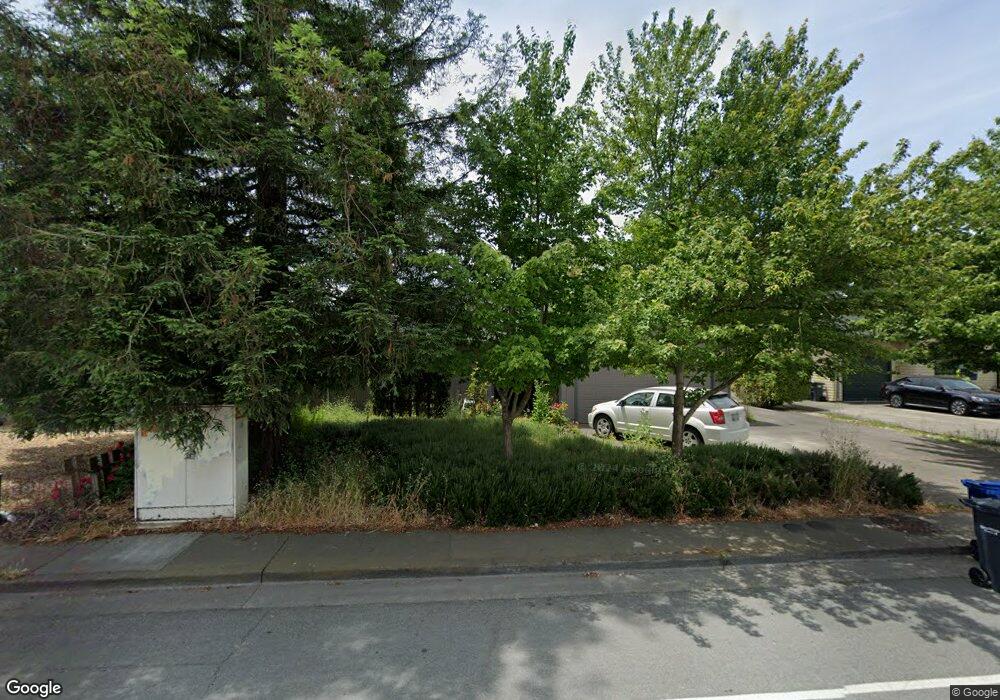
610 S Mcdowell Blvd Petaluma, CA 94954
Adobe NeighborhoodEstimated Value: $821,000 - $1,012,000
3
Beds
2
Baths
1,400
Sq Ft
$642/Sq Ft
Est. Value
About This Home
This home is located at 610 S Mcdowell Blvd, Petaluma, CA 94954 and is currently estimated at $899,239, approximately $642 per square foot. 610 S Mcdowell Blvd is a home located in Sonoma County with nearby schools including McDowell Elementary School, Petaluma Junior High School, and Petaluma High School.
Ownership History
Date
Name
Owned For
Owner Type
Purchase Details
Closed on
Mar 11, 2011
Sold by
Schmierer Caron and Fiduciary Resource Inc
Bought by
Johnson Lee and Simpson Susan
Current Estimated Value
Home Financials for this Owner
Home Financials are based on the most recent Mortgage that was taken out on this home.
Original Mortgage
$150,000
Outstanding Balance
$6,905
Interest Rate
4.75%
Mortgage Type
New Conventional
Estimated Equity
$892,334
Purchase Details
Closed on
Aug 19, 1994
Sold by
Pipkin Dolorez J
Bought by
Pipkin Dolorez J and Dolorez J Pipkin Trust
Home Financials for this Owner
Home Financials are based on the most recent Mortgage that was taken out on this home.
Original Mortgage
$145,750
Interest Rate
7.87%
Purchase Details
Closed on
Aug 15, 1994
Sold by
Pipkin Dolorez J and Dolorez J Pipkin Trust
Bought by
Pipkin Dolorez J
Home Financials for this Owner
Home Financials are based on the most recent Mortgage that was taken out on this home.
Original Mortgage
$145,750
Interest Rate
7.87%
Create a Home Valuation Report for This Property
The Home Valuation Report is an in-depth analysis detailing your home's value as well as a comparison with similar homes in the area
Home Values in the Area
Average Home Value in this Area
Purchase History
| Date | Buyer | Sale Price | Title Company |
|---|---|---|---|
| Johnson Lee | $375,000 | First American Title Company | |
| Pipkin Dolorez J | -- | -- | |
| Pipkin Dolorez J | -- | Old Republic Title Company |
Source: Public Records
Mortgage History
| Date | Status | Borrower | Loan Amount |
|---|---|---|---|
| Open | Johnson Lee | $150,000 | |
| Previous Owner | Pipkin Dolorez J | $145,750 |
Source: Public Records
Tax History Compared to Growth
Tax History
| Year | Tax Paid | Tax Assessment Tax Assessment Total Assessment is a certain percentage of the fair market value that is determined by local assessors to be the total taxable value of land and additions on the property. | Land | Improvement |
|---|---|---|---|---|
| 2025 | $10,278 | $955,086 | $382,034 | $573,052 |
| 2024 | $10,278 | $936,360 | $374,544 | $561,816 |
| 2023 | $10,278 | $918,000 | $367,200 | $550,800 |
| 2022 | $5,102 | $452,721 | $144,869 | $307,852 |
| 2021 | $5,008 | $443,845 | $142,029 | $301,816 |
| 2020 | $5,050 | $439,295 | $140,573 | $298,722 |
| 2019 | $4,989 | $430,682 | $137,817 | $292,865 |
| 2018 | $4,970 | $422,238 | $135,115 | $287,123 |
| 2017 | $4,868 | $413,960 | $132,466 | $281,494 |
| 2016 | $4,751 | $405,844 | $129,869 | $275,975 |
| 2015 | $4,686 | $399,749 | $127,919 | $271,830 |
| 2014 | $4,664 | $391,920 | $125,414 | $266,506 |
Source: Public Records
Map
Nearby Homes
- 29 Alta Dr
- 1293 Pacific Ave
- 1312 Glenwood Dr
- 637 Saint Francis Dr
- 73 Alta Dr
- 1303 Ponderosa Dr
- 840 Sprucewood Ct
- 1108 Gumwood Ln
- 228 S Mcdowell Blvd
- 844 Cedarwood Ln
- 1513 Elizabeth Dr
- 1688 Kearny Ct
- 642 Albert Way
- 1711 Capistrano Dr
- 1821 Lakeville Hwy Unit 77
- 1705 Clairmont Ct
- 1627 Juliet Dr
- 1785 Pine Ave
- 1638 Lauren Dr
- 601 Marylyn Cir Unit 21
- 630 S Mcdowell Blvd
- 604 S Mcdowell Blvd
- 1329 Marian Way
- 1325 Marian Way
- 1332 Lindberg Ln
- 1341 Marian Way
- 1337 Marian Way
- 1328 Lindberg Ln
- 1333 Marian Way
- 1400 Sierra Dr
- 1401 Sierra Dr
- 1324 Lindberg Ln
- 1321 Marian Way
- 1401 Sarkesian Dr
- 1404 Sierra Dr
- 1324 Marian Way
- 1400 Weaverly Dr
- 1405 Sierra Dr
- 1317 Marian Way
- 532 S Mcdowell Blvd