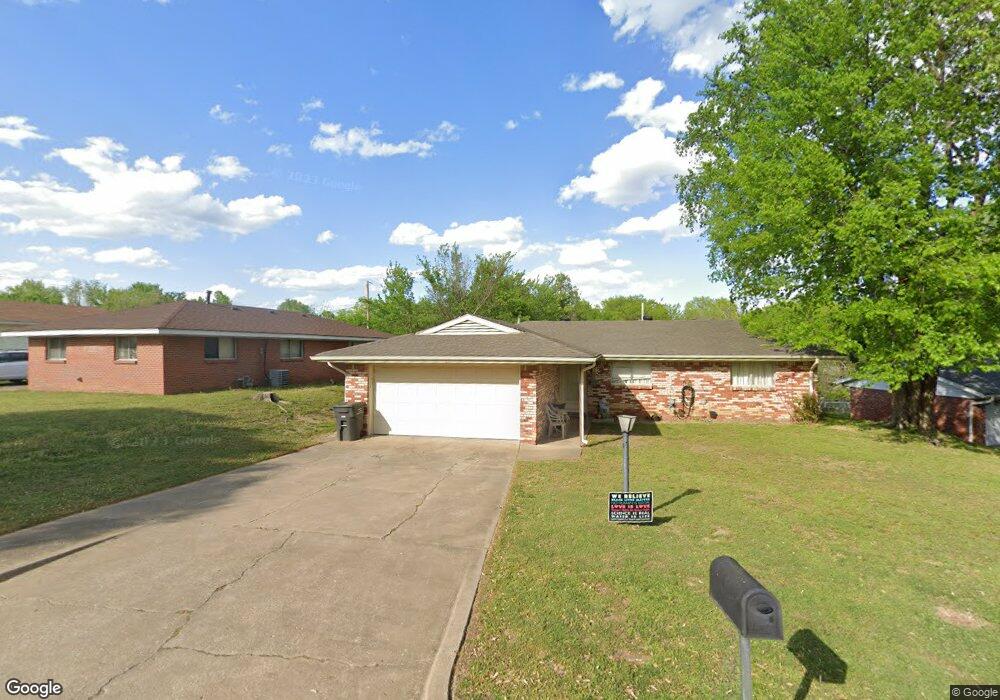
610 SE Elmhurst Ave Bartlesville, OK 74006
Estimated Value: $116,000 - $130,960
3
Beds
2
Baths
1,225
Sq Ft
$101/Sq Ft
Est. Value
About This Home
This home is located at 610 SE Elmhurst Ave, Bartlesville, OK 74006 and is currently estimated at $124,240, approximately $101 per square foot. 610 SE Elmhurst Ave is a home located in Washington County with nearby schools including Ranch Heights Elementary School, Madison Middle School, and Bartlesville High School.
Ownership History
Date
Name
Owned For
Owner Type
Purchase Details
Closed on
Feb 14, 2007
Sold by
Faulkner Steven J and Faulkner Jodi
Bought by
Crow John K and Crow Dianne K
Current Estimated Value
Home Financials for this Owner
Home Financials are based on the most recent Mortgage that was taken out on this home.
Original Mortgage
$72,229
Outstanding Balance
$43,260
Interest Rate
6.25%
Mortgage Type
FHA
Estimated Equity
$80,980
Purchase Details
Closed on
Nov 8, 2006
Sold by
Wooldridge Tricia and Shrum Judith
Bought by
Faulkner Steven J and Faulkner Jodi
Home Financials for this Owner
Home Financials are based on the most recent Mortgage that was taken out on this home.
Original Mortgage
$37,037
Interest Rate
6.37%
Mortgage Type
Purchase Money Mortgage
Purchase Details
Closed on
Dec 28, 1999
Sold by
Dizmang Elizabeth A Rev Trust
Purchase Details
Closed on
Dec 1, 1994
Sold by
Fairfield Affiliates
Purchase Details
Closed on
Nov 21, 1994
Sold by
Adler Roger
Create a Home Valuation Report for This Property
The Home Valuation Report is an in-depth analysis detailing your home's value as well as a comparison with similar homes in the area
Home Values in the Area
Average Home Value in this Area
Purchase History
| Date | Buyer | Sale Price | Title Company |
|---|---|---|---|
| Crow John K | $73,000 | None Available | |
| Faulkner Steven J | $36,000 | None Available | |
| Woolridge Tricia | $52,000 | None Available | |
| -- | -- | -- | |
| -- | $19,000 | -- | |
| -- | -- | -- |
Source: Public Records
Mortgage History
| Date | Status | Borrower | Loan Amount |
|---|---|---|---|
| Open | Crow John K | $72,229 | |
| Previous Owner | Woolridge Tricia | $37,037 |
Source: Public Records
Tax History Compared to Growth
Tax History
| Year | Tax Paid | Tax Assessment Tax Assessment Total Assessment is a certain percentage of the fair market value that is determined by local assessors to be the total taxable value of land and additions on the property. | Land | Improvement |
|---|---|---|---|---|
| 2025 | $1,117 | $9,768 | $1,020 | $8,748 |
| 2024 | $1,117 | $9,303 | $1,020 | $8,283 |
| 2023 | $1,117 | $8,860 | $1,020 | $7,840 |
| 2022 | $1,061 | $8,860 | $1,020 | $7,840 |
| 2021 | $1,040 | $8,860 | $1,020 | $7,840 |
| 2020 | $1,064 | $8,860 | $1,020 | $7,840 |
| 2019 | $1,062 | $8,840 | $1,020 | $7,820 |
| 2018 | $1,057 | $8,840 | $1,020 | $7,820 |
| 2017 | $1,081 | $8,840 | $1,020 | $7,820 |
| 2016 | $1,015 | $8,840 | $1,020 | $7,820 |
| 2015 | $1,241 | $10,648 | $1,068 | $9,580 |
| 2014 | $1,178 | $10,141 | $1,068 | $9,073 |
Source: Public Records
Map
Nearby Homes
- 644 SE Elmhurst Ave
- 4701 Dartmouth Dr
- 4732 Cornell Dr
- 4709 Amherst Dr
- 4900 E Frank Phillips Blvd
- 953 Yale Dr
- 4800 E Frank Phillips Blvd
- 1000 Meadow Dr
- 332 Brookline Place
- 4507 E Frank Phillips Blvd
- 5012 Allen Ct
- 4512 E Frank Phillips Blvd
- 0 SE Adams Rd Unit 2541155
- 4916 Cornell Dr
- 1050 Grandview Rd
- 1063 Rolling Meadows Ct
- 4917 Amherst Dr
- 4626 Rolling Meadows Rd
- 397 Fleetwood Dr
- 1054 Meadow Dr
- 616 SE Elmhurst Ave
- 604 SE Elmhurst Ave
- 620 SE Elmhurst Ave
- 600 SE Elmhurst Ave
- 624 SE Elmhurst Ave
- 596 SE Elmhurst Ave
- 607 SE Elmhurst Ave
- 611 SE Elmhurst Ave
- 603 SE Elmhurst Ave
- 615 SE Elmhurst Ave
- 628 SE Elmhurst Ave
- 592 SE Elmhurst Ave
- 599 SE Elmhurst Ave
- 619 SE Elmhurst Ave
- 588 SE Elmhurst Ave
- 595 SE Elmhurst Ave
- 623 SE Elmhurst Ave
- 713 Yale Dr
- 717 Yale Dr
- 709 Yale Dr