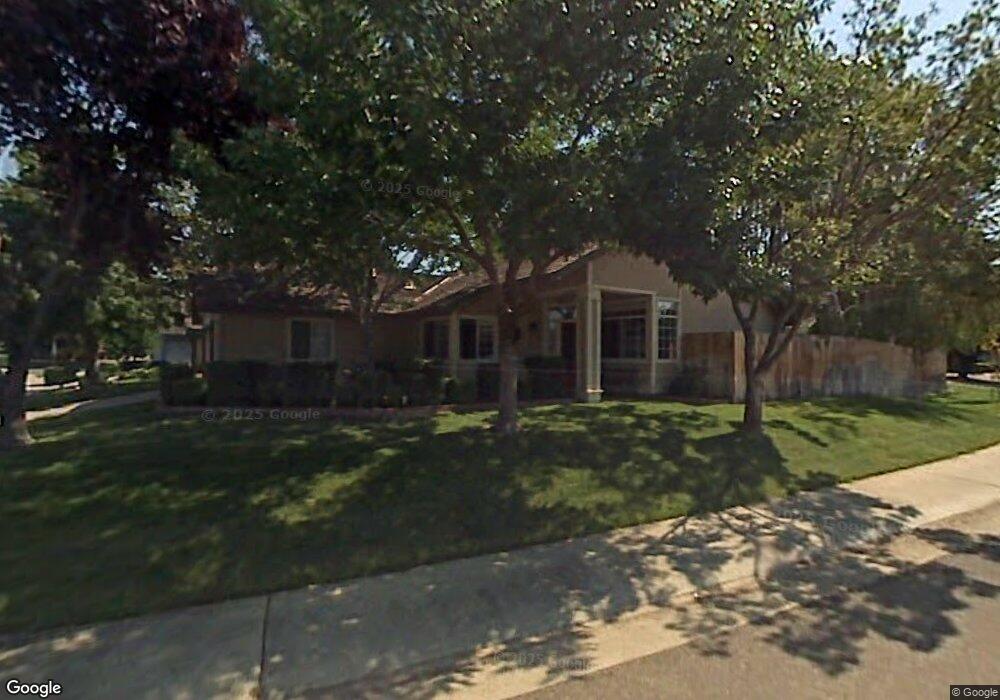
6100 Alpinespring Way Elk Grove, CA 95758
North West Elk Grove NeighborhoodEstimated Value: $471,000 - $526,000
3
Beds
2
Baths
1,240
Sq Ft
$394/Sq Ft
Est. Value
About This Home
This home is located at 6100 Alpinespring Way, Elk Grove, CA 95758 and is currently estimated at $488,653, approximately $394 per square foot. 6100 Alpinespring Way is a home located in Sacramento County with nearby schools including John Ehrhardt Elementary School, Harriet G. Eddy Middle School, and Laguna Creek High School.
Ownership History
Date
Name
Owned For
Owner Type
Purchase Details
Closed on
Nov 9, 2010
Sold by
Byrne Patrick D and Byrne Marianne
Bought by
Byrne Patrick David and Byrne Marianne Gladys
Current Estimated Value
Purchase Details
Closed on
Feb 22, 1999
Sold by
Morgado Jason L and Tracy Rice
Bought by
Byrne Patrick D and Byrne Marianne
Home Financials for this Owner
Home Financials are based on the most recent Mortgage that was taken out on this home.
Original Mortgage
$126,033
Outstanding Balance
$29,934
Interest Rate
6.78%
Mortgage Type
FHA
Estimated Equity
$458,719
Purchase Details
Closed on
Jun 17, 1994
Sold by
Strech Michael E and Strech Laura M
Bought by
Morgado Jason L and Rice Tracy
Home Financials for this Owner
Home Financials are based on the most recent Mortgage that was taken out on this home.
Original Mortgage
$127,265
Interest Rate
8.6%
Mortgage Type
FHA
Create a Home Valuation Report for This Property
The Home Valuation Report is an in-depth analysis detailing your home's value as well as a comparison with similar homes in the area
Home Values in the Area
Average Home Value in this Area
Purchase History
| Date | Buyer | Sale Price | Title Company |
|---|---|---|---|
| Byrne Patrick David | -- | None Available | |
| Byrne Patrick D | $127,500 | Fidelity National Title Co | |
| Morgado Jason L | $128,500 | -- |
Source: Public Records
Mortgage History
| Date | Status | Borrower | Loan Amount |
|---|---|---|---|
| Open | Byrne Patrick D | $126,033 | |
| Previous Owner | Morgado Jason L | $127,265 |
Source: Public Records
Tax History Compared to Growth
Tax History
| Year | Tax Paid | Tax Assessment Tax Assessment Total Assessment is a certain percentage of the fair market value that is determined by local assessors to be the total taxable value of land and additions on the property. | Land | Improvement |
|---|---|---|---|---|
| 2025 | $2,500 | $199,859 | $62,695 | $137,164 |
| 2024 | $2,500 | $195,941 | $61,466 | $134,475 |
| 2023 | $2,428 | $192,100 | $60,261 | $131,839 |
| 2022 | $2,388 | $188,334 | $59,080 | $129,254 |
| 2021 | $2,332 | $184,642 | $57,922 | $126,720 |
| 2020 | $2,297 | $182,750 | $57,329 | $125,421 |
| 2019 | $2,251 | $179,167 | $56,205 | $122,962 |
| 2018 | $2,192 | $175,654 | $55,103 | $120,551 |
| 2017 | $2,147 | $172,211 | $54,023 | $118,188 |
| 2016 | $2,055 | $168,835 | $52,964 | $115,871 |
| 2015 | $2,014 | $166,300 | $52,169 | $114,131 |
| 2014 | $1,989 | $163,044 | $51,148 | $111,896 |
Source: Public Records
Map
Nearby Homes
- 0 Elliott Ranch Rd Unit 225131105
- 6024 Deepdale Way
- 6131 Jacinto Ave
- 8741 Noble Fir Ln
- 1312 Winterhart St
- 5310 Privet Ln
- 6925 Risata Way
- 8869 Jessup Ct
- 6465 Laguna Mirage Ln
- 5161 Saint Edwards Way
- 9105 Turnbull Ct
- 6411 Jacinto Ave
- 6411 Jacinto Way
- 8647 Starburst Way
- 6419 Jacinto Ave
- 6419 Jacinto Way
- 6348 Laguna Mirage Ln
- Biltmore Plan at Ventris Place
- Carefree Plan at Ventris Place
- Astoria Plan at Ventris Place
- 6104 Alpinespring Way
- 8917 Willowspring Ct
- 6108 Alpinespring Way
- 8914 Willowspring Ct
- 6101 Alpinespring Way
- 6128 Alpinespring Way
- 8918 Willowspring Ct
- 8921 Willowspring Ct
- 6025 Alpinespring Way
- 6109 Alpinespring Way
- 6200 Alpinespring Way
- 6016 Alpinespring Way
- 6019 Alpinespring Way
- 8922 Willowspring Ct
- 8925 Willowspring Ct
- 8925 Meadowspring Dr
- 6030 Ivy Spring Ct
- 6121 Alpinespring Way
- 6035 Ivy Spring Ct
- 6204 Alpinespring Way