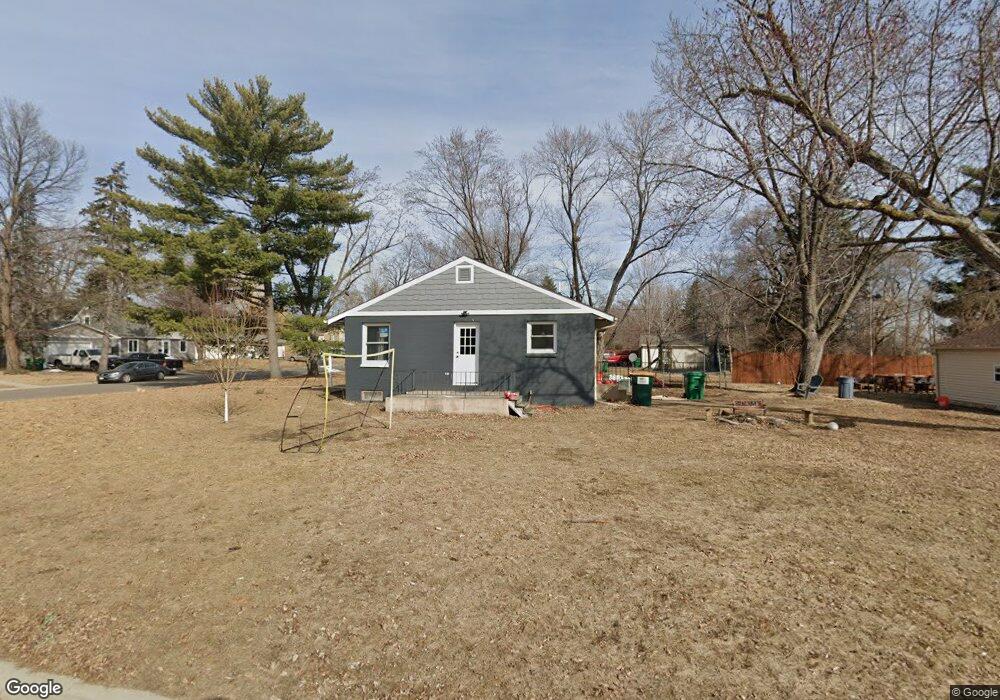
6100 Camden Ave N Minneapolis, MN 55430
Grandview NeighborhoodEstimated Value: $276,000 - $293,251
3
Beds
2
Baths
1,639
Sq Ft
$175/Sq Ft
Est. Value
About This Home
This home is located at 6100 Camden Ave N, Minneapolis, MN 55430 and is currently estimated at $287,063, approximately $175 per square foot. 6100 Camden Ave N is a home located in Hennepin County with nearby schools including Brooklyn Center Elementary STEAM, Bright Water MontessoriSchool, and KIPP North Star Primary.
Ownership History
Date
Name
Owned For
Owner Type
Purchase Details
Closed on
May 24, 2021
Sold by
Maldonado Cynthia E and Martinez Ezequiel Medonzado
Bought by
Barreto Jair
Current Estimated Value
Home Financials for this Owner
Home Financials are based on the most recent Mortgage that was taken out on this home.
Original Mortgage
$240,068
Outstanding Balance
$217,352
Interest Rate
2.9%
Mortgage Type
Stand Alone Second
Estimated Equity
$69,711
Purchase Details
Closed on
Mar 25, 2019
Sold by
Novak Kathryn Mary
Bought by
Morquecho Cynthia E
Home Financials for this Owner
Home Financials are based on the most recent Mortgage that was taken out on this home.
Original Mortgage
$216,015
Interest Rate
4.87%
Mortgage Type
FHA
Purchase Details
Closed on
May 29, 1997
Sold by
Williams Caroline Grace
Bought by
Dullum Brent T and Dullum Kathryn M Coffman
Create a Home Valuation Report for This Property
The Home Valuation Report is an in-depth analysis detailing your home's value as well as a comparison with similar homes in the area
Home Values in the Area
Average Home Value in this Area
Purchase History
| Date | Buyer | Sale Price | Title Company |
|---|---|---|---|
| Barreto Jair | $251,000 | None Available | |
| Morquecho Cynthia E | $220,000 | Burnet Title | |
| Dullum Brent T | $88,500 | -- | |
| Barreto Jair Jair | $251,000 | -- |
Source: Public Records
Mortgage History
| Date | Status | Borrower | Loan Amount |
|---|---|---|---|
| Open | Barreto Jair | $240,068 | |
| Closed | Barreto Jair | $240,068 | |
| Previous Owner | Morquecho Cynthia E | $216,015 | |
| Closed | Barreto Jair Jair | $239,043 |
Source: Public Records
Tax History Compared to Growth
Tax History
| Year | Tax Paid | Tax Assessment Tax Assessment Total Assessment is a certain percentage of the fair market value that is determined by local assessors to be the total taxable value of land and additions on the property. | Land | Improvement |
|---|---|---|---|---|
| 2024 | $4,361 | $252,800 | $64,000 | $188,800 |
| 2023 | $3,995 | $253,200 | $65,000 | $188,200 |
| 2022 | $3,165 | $257,000 | $76,000 | $181,000 |
| 2021 | $3,364 | $221,000 | $62,000 | $159,000 |
| 2020 | $3,072 | $206,000 | $56,000 | $150,000 |
| 2019 | $3,200 | $189,000 | $50,000 | $139,000 |
| 2018 | $2,818 | $188,000 | $45,000 | $143,000 |
| 2017 | $2,298 | $151,000 | $35,000 | $116,000 |
| 2016 | $2,421 | $145,000 | $40,000 | $105,000 |
| 2015 | $2,017 | $129,200 | $35,900 | $93,300 |
| 2014 | -- | $114,100 | $34,400 | $79,700 |
Source: Public Records
Map
Nearby Homes
- 6518 W River Rd
- 6100 Colfax Ave N
- 6000 Girard Ave N
- 6542 Riverwood Ln
- 5654 Bryant Ave N
- 6618 Camden Dr
- 5715 Emerson Ave N
- 5637 Bryant Ave N
- 5706 Girard Ave N
- 5842 James Ave N
- 5500 Bryant Ave N
- 5527 Fremont Ave N
- 6807 Aldrich Ave N
- 5524 Humboldt Ave N
- 1327 67th Ln N
- 5337 Lyndale Ave N
- 6823 Fremont Place N
- 6918 Willow Ln
- 6777 Humboldt Ave N
- 5344 Girard Ave N
- 6106 Camden Ave N
- 510 61st Ave N
- 6042 Camden Ave N
- 6116 Camden Ave N
- 6135 Camden Ave N
- 506 61st Ave N
- 6101 Camden Ave N
- 6036 Camden Ave N
- 6107 Camden Ave N
- 6043 Camden Ave N
- 6122 Camden Ave N
- 6117 Camden Ave N
- 6037 Camden Ave N
- 6030 Camden Ave N
- 6101 Lyndale Ave N
- 6109 Lyndale Ave N
- 6128 Camden Ave N
- 6125 Camden Ave N
- 6041 Lyndale Ave N
- 505 61st Ave N