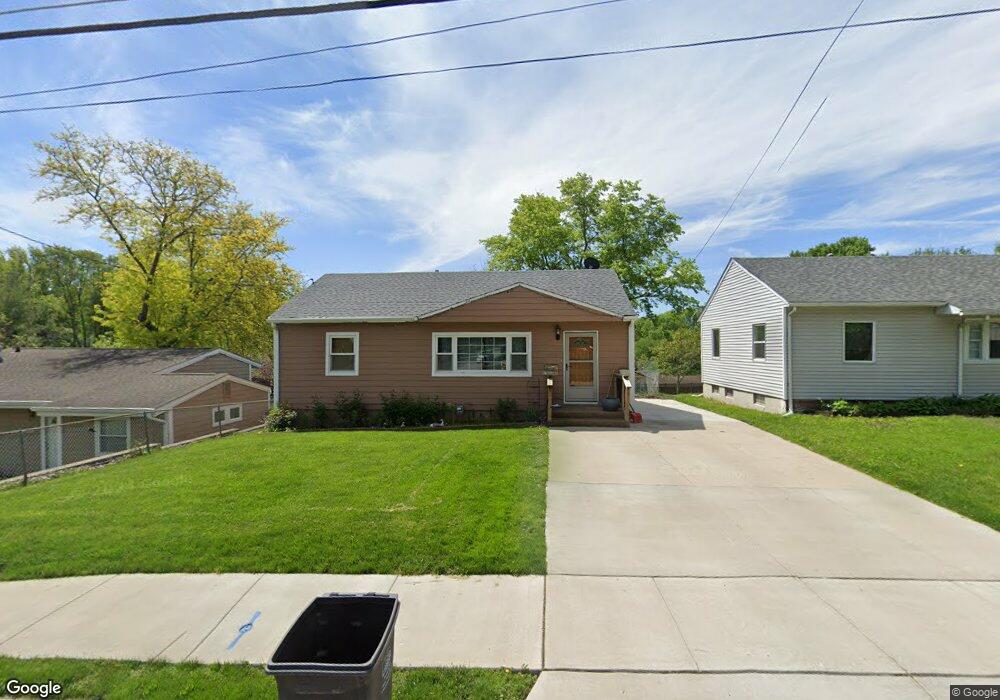
6100 Clark St Des Moines, IA 50311
Merle Hay NeighborhoodEstimated Value: $185,000 - $200,000
2
Beds
1
Bath
864
Sq Ft
$223/Sq Ft
Est. Value
About This Home
This home is located at 6100 Clark St, Des Moines, IA 50311 and is currently estimated at $192,655, approximately $222 per square foot. 6100 Clark St is a home located in Polk County with nearby schools including Windsor Elementary School, Merrill Middle School, and Roosevelt High School.
Ownership History
Date
Name
Owned For
Owner Type
Purchase Details
Closed on
Apr 8, 2020
Sold by
Cordova Ramiro and Cordova Isabel
Bought by
Redrovan Charlie and Cordova Jose
Current Estimated Value
Purchase Details
Closed on
Feb 14, 2017
Sold by
Cordova Ramiro
Bought by
Cordova Ramiro and Redrovan Charlie
Purchase Details
Closed on
Jul 25, 2003
Sold by
Taylor John R
Bought by
Cordova Ramira
Home Financials for this Owner
Home Financials are based on the most recent Mortgage that was taken out on this home.
Original Mortgage
$103,184
Outstanding Balance
$44,001
Interest Rate
5.3%
Mortgage Type
FHA
Estimated Equity
$148,654
Purchase Details
Closed on
May 22, 1998
Sold by
Smith Tabitha J
Bought by
Taylor John R
Home Financials for this Owner
Home Financials are based on the most recent Mortgage that was taken out on this home.
Original Mortgage
$75,932
Interest Rate
7.27%
Mortgage Type
FHA
Create a Home Valuation Report for This Property
The Home Valuation Report is an in-depth analysis detailing your home's value as well as a comparison with similar homes in the area
Home Values in the Area
Average Home Value in this Area
Purchase History
| Date | Buyer | Sale Price | Title Company |
|---|---|---|---|
| Redrovan Charlie | -- | None Available | |
| Cordova Ramiro | -- | None Available | |
| Cordova Ramira | $103,500 | -- | |
| Taylor John R | $75,500 | -- |
Source: Public Records
Mortgage History
| Date | Status | Borrower | Loan Amount |
|---|---|---|---|
| Open | Cordova Ramira | $103,184 | |
| Previous Owner | Taylor John R | $75,932 |
Source: Public Records
Tax History Compared to Growth
Tax History
| Year | Tax Paid | Tax Assessment Tax Assessment Total Assessment is a certain percentage of the fair market value that is determined by local assessors to be the total taxable value of land and additions on the property. | Land | Improvement |
|---|---|---|---|---|
| 2025 | $3,004 | $170,300 | $43,100 | $127,200 |
| 2024 | $3,004 | $152,700 | $38,000 | $114,700 |
| 2023 | $3,184 | $152,700 | $38,000 | $114,700 |
| 2022 | $3,160 | $135,100 | $34,300 | $100,800 |
| 2021 | $3,026 | $135,100 | $34,300 | $100,800 |
| 2020 | $3,144 | $121,300 | $30,500 | $90,800 |
| 2019 | $2,898 | $121,300 | $30,500 | $90,800 |
| 2018 | $2,868 | $107,800 | $26,700 | $81,100 |
| 2017 | $2,582 | $107,800 | $26,700 | $81,100 |
| 2016 | $2,516 | $95,500 | $23,200 | $72,300 |
| 2015 | $2,516 | $95,500 | $23,200 | $72,300 |
| 2014 | $2,270 | $85,400 | $20,700 | $64,700 |
Source: Public Records
Map
Nearby Homes