Estimated Value: $182,401 - $312,000
2
Beds
2
Baths
950
Sq Ft
$239/Sq Ft
Est. Value
About This Home
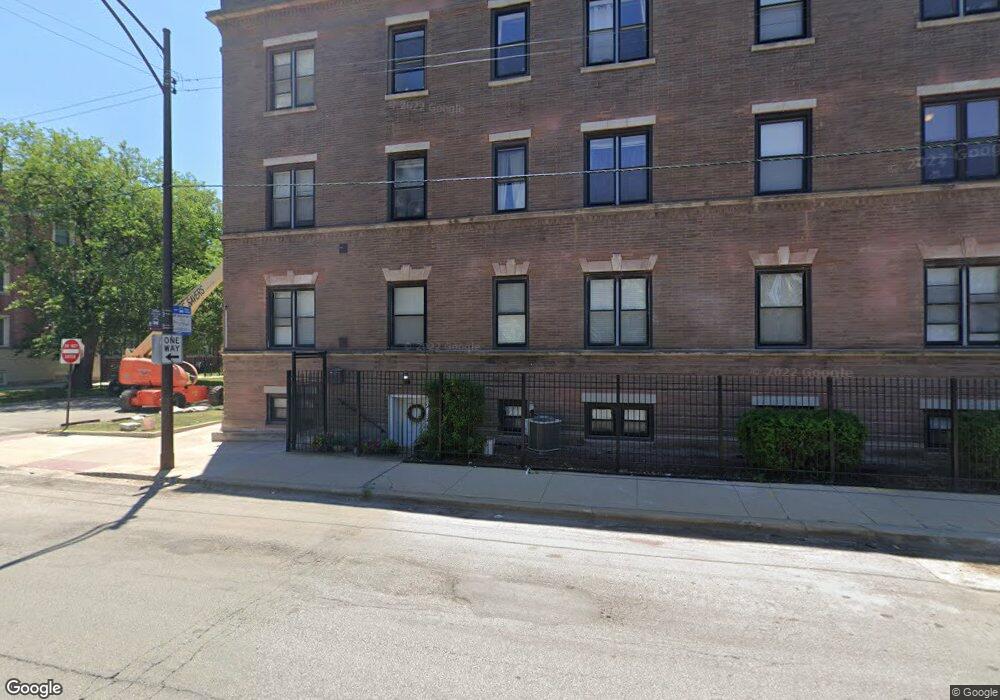
This home is located at 6100 S University Ave Unit 6100, Chicago, IL 60637 and is currently estimated at $226,600, approximately $238 per square foot. 6100 S University Ave Unit 6100 is a home located in Cook County with nearby schools including Fiske Elementary School, Hyde Park Academy High School, and Univ of Chicago Chtr-Woodlawn.
Ownership History
Date
Name
Owned For
Owner Type
Purchase Details
Closed on
Sep 23, 2017
Sold by
Carroll Michael S and Kanter Bonnie
Bought by
Benjamin Brandon
Current Estimated Value
Home Financials for this Owner
Home Financials are based on the most recent Mortgage that was taken out on this home.
Original Mortgage
$168,295
Outstanding Balance
$140,425
Interest Rate
3.87%
Mortgage Type
New Conventional
Estimated Equity
$86,175
Purchase Details
Closed on
May 7, 2002
Sold by
Michaels Kenneth A
Bought by
Leahey James and Leahey Elizabeth
Purchase Details
Closed on
Aug 31, 2001
Sold by
Leahey James and Leahey Elizabeth
Bought by
Michaels Kenneth A and University Fields Condominium Trust #1
Purchase Details
Closed on
Jan 30, 2001
Sold by
South University Llc
Bought by
Leahey James P and Leahey Elizabeth
Home Financials for this Owner
Home Financials are based on the most recent Mortgage that was taken out on this home.
Original Mortgage
$133,350
Interest Rate
7.22%
Mortgage Type
FHA
Create a Home Valuation Report for This Property
The Home Valuation Report is an in-depth analysis detailing your home's value as well as a comparison with similar homes in the area
Home Values in the Area
Average Home Value in this Area
Purchase History
| Date | Buyer | Sale Price | Title Company |
|---|---|---|---|
| Benjamin Brandon | $173,500 | Near North National Title | |
| Leahey James | -- | -- | |
| Michaels Kenneth A | -- | -- | |
| Leahey James P | $137,500 | Chicago Title Insurance Co |
Source: Public Records
Mortgage History
| Date | Status | Borrower | Loan Amount |
|---|---|---|---|
| Open | Benjamin Brandon | $168,295 | |
| Previous Owner | Leahey James P | $133,350 |
Source: Public Records
Tax History Compared to Growth
Tax History
| Year | Tax Paid | Tax Assessment Tax Assessment Total Assessment is a certain percentage of the fair market value that is determined by local assessors to be the total taxable value of land and additions on the property. | Land | Improvement |
|---|---|---|---|---|
| 2024 | $2,964 | $22,858 | $770 | $22,088 |
| 2023 | $2,879 | $14,001 | $770 | $13,231 |
| 2022 | $2,879 | $14,001 | $770 | $13,231 |
| 2021 | $2,815 | $13,999 | $769 | $13,230 |
| 2020 | $2,384 | $10,702 | $677 | $10,025 |
| 2019 | $2,369 | $11,791 | $677 | $11,114 |
| 2018 | $2,329 | $11,791 | $677 | $11,114 |
| 2017 | $1,494 | $10,316 | $615 | $9,701 |
| 2016 | $1,566 | $10,316 | $615 | $9,701 |
| 2015 | $1,410 | $10,316 | $615 | $9,701 |
| 2014 | $2,410 | $15,558 | $507 | $15,051 |
| 2013 | $2,351 | $15,558 | $507 | $15,051 |
Source: Public Records
About This Building
Map
Nearby Homes
- 1127 E 61st St Unit 3
- 6109 S Greenwood Ave
- 1167 E 61st St Unit 2
- 6148 S Woodlawn Ave Unit 3A
- 6123 S Ellis Ave
- 6121 S Woodlawn Ave Unit 2
- 6216 S Woodlawn Ave Unit F
- 6216 S Woodlawn Ave Unit A
- 6218 S Woodlawn Ave Unit B
- 6218 S Woodlawn Ave Unit A
- 6218 S Woodlawn Ave Unit H
- 6224 S Greenwood Ave
- 967 E 62nd St Unit 2
- 965 E 62nd St Unit 1
- 953 E 61st St Unit 1E
- 6103 S Ingleside Ave Unit 1
- 6101 S Kimbark Ave Unit 3
- 6233 S Woodlawn Ave Unit 2
- 6239 S Ellis Ave
- 6106 S Ingleside Ave Unit 2
- 6100 S University Ave Unit 3
- 1127 E 61st St Unit 1
- 6100 S University Ave Unit 6100
- 1127 E 61st St Unit 11271
- 1127 E 61st St Unit 11273
- 1127 E 61st St Unit 11272
- 6100 S University Ave Unit 6100
- 6100 S University Ave Unit 1
- 1125 E 61st St Unit 11252
- 1125 E 61st St Unit 11253
- 1125 E 61st St Unit 11251
- 1125 E 61st St Unit 1
- 1133 E 61st St Unit 11333
- 1131 E 61st St Unit 11313
- 1133 E 61st St Unit 11332
- 1131 E 61st St Unit 11312
- 1133 E 61st St Unit 11331
- 1131 E 61st St Unit 11311
- 1131 E 61st St
- 1131 E 61st St Unit 3