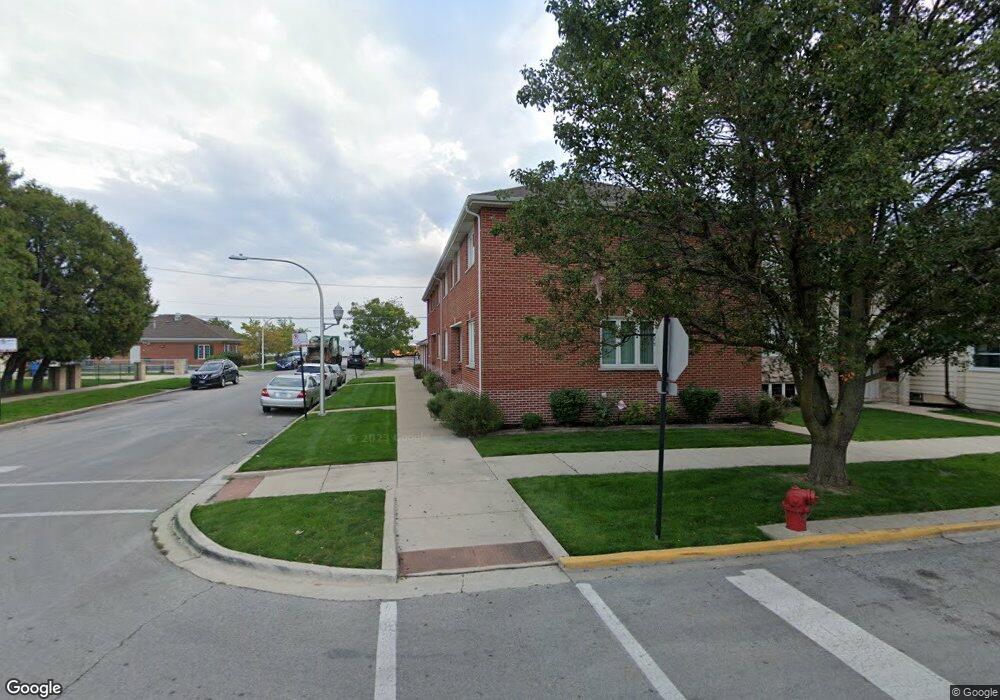
6101 S Parkside Ave Chicago, IL 60638
Clearing NeighborhoodEstimated Value: $237,000 - $362,000
3
Beds
2
Baths
1,416
Sq Ft
$207/Sq Ft
Est. Value
About This Home
This home is located at 6101 S Parkside Ave, Chicago, IL 60638 and is currently estimated at $292,440, approximately $206 per square foot. 6101 S Parkside Ave is a home located in Cook County with nearby schools including Hale Elementary School, Kennedy High School, and St. Symphorosa Catholic School.
Ownership History
Date
Name
Owned For
Owner Type
Purchase Details
Closed on
Nov 14, 2016
Sold by
State Bank Of Texas
Bought by
Vela Blanca
Current Estimated Value
Home Financials for this Owner
Home Financials are based on the most recent Mortgage that was taken out on this home.
Original Mortgage
$142,348
Outstanding Balance
$114,568
Interest Rate
3.5%
Mortgage Type
FHA
Estimated Equity
$177,872
Purchase Details
Closed on
Jun 25, 2015
Sold by
Bertucci Kathleen M and Bertucci Kathleen
Bought by
State Bank Of Texas and The Federal Deposit Insurance Corporatio
Purchase Details
Closed on
Apr 16, 1999
Sold by
Prairie Bank & Trust Company
Bought by
Bertucci Kathleen M
Home Financials for this Owner
Home Financials are based on the most recent Mortgage that was taken out on this home.
Original Mortgage
$102,000
Interest Rate
7.17%
Mortgage Type
Seller Take Back
Create a Home Valuation Report for This Property
The Home Valuation Report is an in-depth analysis detailing your home's value as well as a comparison with similar homes in the area
Home Values in the Area
Average Home Value in this Area
Purchase History
| Date | Buyer | Sale Price | Title Company |
|---|---|---|---|
| Vela Blanca | $145,500 | First American Title | |
| State Bank Of Texas | -- | None Available | |
| Bertucci Kathleen M | $122,000 | 1St American Title |
Source: Public Records
Mortgage History
| Date | Status | Borrower | Loan Amount |
|---|---|---|---|
| Open | Vela Blanca | $142,348 | |
| Previous Owner | Bertucci Kathleen M | $102,000 |
Source: Public Records
Tax History Compared to Growth
Tax History
| Year | Tax Paid | Tax Assessment Tax Assessment Total Assessment is a certain percentage of the fair market value that is determined by local assessors to be the total taxable value of land and additions on the property. | Land | Improvement |
|---|---|---|---|---|
| 2024 | $4,176 | $27,000 | $1,299 | $25,701 |
| 2023 | $4,050 | $23,000 | $1,160 | $21,840 |
| 2022 | $4,050 | $23,000 | $1,160 | $21,840 |
| 2021 | $3,955 | $23,000 | $1,160 | $21,840 |
| 2020 | $3,298 | $17,809 | $928 | $16,881 |
| 2019 | $3,308 | $19,788 | $928 | $18,860 |
| 2018 | $3,251 | $19,788 | $928 | $18,860 |
| 2017 | $3,950 | $18,227 | $835 | $17,392 |
| 2016 | $3,171 | $18,227 | $835 | $17,392 |
| 2015 | $2,880 | $18,227 | $835 | $17,392 |
| 2014 | $2,876 | $17,950 | $788 | $17,162 |
| 2013 | -- | $17,950 | $788 | $17,162 |
Source: Public Records
Map
Nearby Homes
- 6129 S Parkside Ave
- 6025 S Major Ave
- 6058 S Massasoit Ave
- 6005 S Menard Ave
- 5533 W 63rd Place
- 6016 S Mayfield Ave
- 6037 S Mason Ave
- 5814 S Massasoit Ave
- 5631 W 64th Place
- 5817 W 64th St
- 6152 S Austin Ave
- 5749 W 64th Place
- 5819 S Mason Ave
- 5740 S Monitor Ave
- 6403 S Lorel Ave
- 5827 S Austin Ave
- 6123 S Meade Ave
- 6334 S Austin Ave
- 5810 S Austin Ave
- 6155 S Moody Ave
- 6101 S Parkside Ave
- 6101 S Parkside Ave
- 6101 S Parkside Ave
- 6101 S Parkside Ave Unit C
- 6101 S Parkside Ave Unit B
- 6109 S Parkside Ave
- 6105 S Parkside Ave
- 6107 S Parkside Ave
- 6111 S Parkside Ave
- 6113 S Parkside Ave
- 6113 S Parkside Ave
- 6055 S Parkside Ave
- 6104 S Parkside Ave
- 6106 S Parkside Ave
- 6106 S Parkside Ave
- 6053 S Parkside Ave
- 6108 S Parkside Ave
- 6058 S Parkside Ave
- 6121 S Parkside Ave
- 6100 S Central Ave