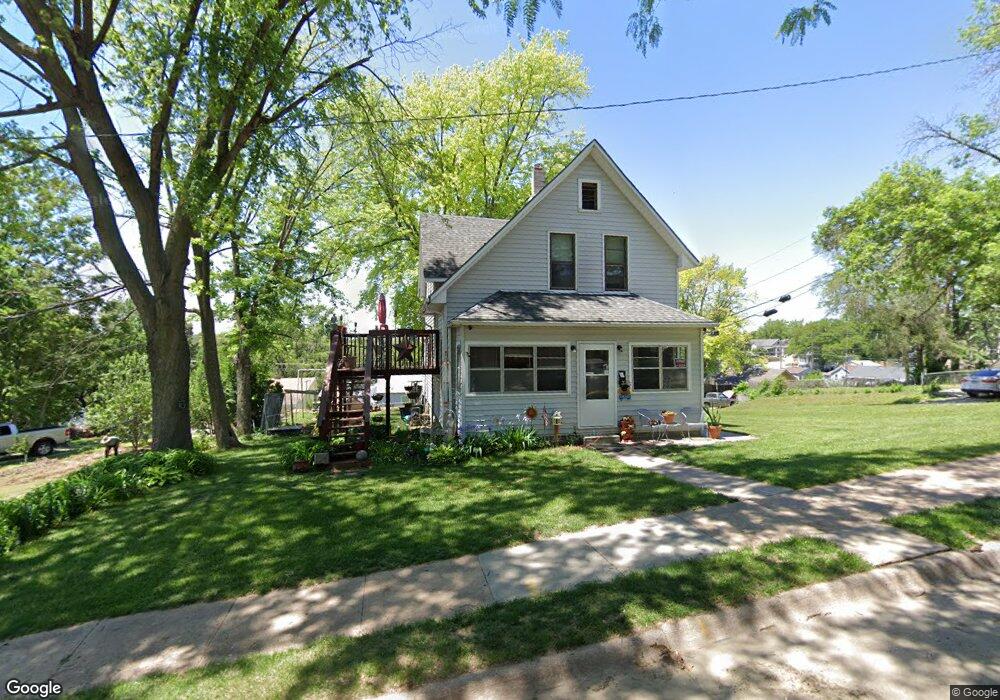
6102 S 18th St Omaha, NE 68107
Brown Park NeighborhoodEstimated Value: $166,000 - $216,000
4
Beds
3
Baths
2,042
Sq Ft
$98/Sq Ft
Est. Value
About This Home
This home is located at 6102 S 18th St, Omaha, NE 68107 and is currently estimated at $200,279, approximately $98 per square foot. 6102 S 18th St is a home located in Douglas County with nearby schools including R.M. Marrs Magnet Middle School, South High School, and Cornerstone Christian School.
Ownership History
Date
Name
Owned For
Owner Type
Purchase Details
Closed on
Jun 25, 2015
Sold by
Rodriguez Lori M and Rodriguez Rick
Bought by
Zuck Julie A
Current Estimated Value
Home Financials for this Owner
Home Financials are based on the most recent Mortgage that was taken out on this home.
Original Mortgage
$50,500
Interest Rate
3.9%
Mortgage Type
Purchase Money Mortgage
Purchase Details
Closed on
Jul 26, 2001
Sold by
Fibich Michael J and Mcdade Anna M
Bought by
Fibich Michael J
Home Financials for this Owner
Home Financials are based on the most recent Mortgage that was taken out on this home.
Original Mortgage
$76,000
Interest Rate
7.16%
Create a Home Valuation Report for This Property
The Home Valuation Report is an in-depth analysis detailing your home's value as well as a comparison with similar homes in the area
Home Values in the Area
Average Home Value in this Area
Purchase History
| Date | Buyer | Sale Price | Title Company |
|---|---|---|---|
| Zuck Julie A | $98,000 | Midwest Title Inc | |
| Fibich Michael J | -- | -- |
Source: Public Records
Mortgage History
| Date | Status | Borrower | Loan Amount |
|---|---|---|---|
| Closed | Zuck Julie A | $50,500 | |
| Previous Owner | Fibich Michael J | $76,000 |
Source: Public Records
Tax History Compared to Growth
Tax History
| Year | Tax Paid | Tax Assessment Tax Assessment Total Assessment is a certain percentage of the fair market value that is determined by local assessors to be the total taxable value of land and additions on the property. | Land | Improvement |
|---|---|---|---|---|
| 2024 | $2,943 | $139,500 | $12,600 | $126,900 |
| 2023 | $2,943 | $139,500 | $12,600 | $126,900 |
| 2022 | $2,201 | $103,100 | $7,700 | $95,400 |
| 2021 | $2,182 | $103,100 | $7,700 | $95,400 |
| 2020 | $1,901 | $88,800 | $5,900 | $82,900 |
| 2019 | $1,907 | $88,800 | $5,900 | $82,900 |
| 2018 | $1,731 | $80,500 | $5,900 | $74,600 |
| 2017 | $1,739 | $80,500 | $5,900 | $74,600 |
| 2016 | $1,727 | $80,500 | $5,900 | $74,600 |
| 2015 | $1,704 | $80,500 | $5,900 | $74,600 |
| 2014 | $1,704 | $80,500 | $5,900 | $74,600 |
Source: Public Records
Map
Nearby Homes