Estimated Value: $696,000 - $827,000
3
Beds
2
Baths
1,730
Sq Ft
$452/Sq Ft
Est. Value
About This Home
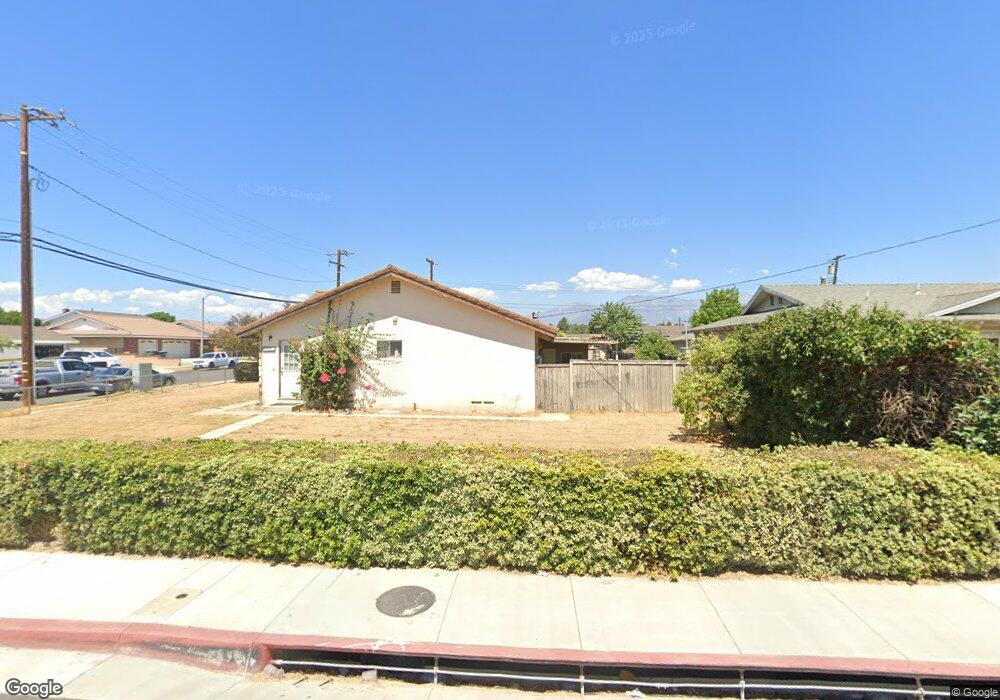
This home is located at 6102 Walnut Ave, Chino, CA 91710 and is currently estimated at $781,267, approximately $451 per square foot. 6102 Walnut Ave is a home located in San Bernardino County with nearby schools including Alicia Cortez Elementary, Magnolia Junior High, and Chino High School.
Ownership History
Date
Name
Owned For
Owner Type
Purchase Details
Closed on
Jul 20, 2005
Sold by
Richardson John P
Bought by
Frias Joseph A
Current Estimated Value
Home Financials for this Owner
Home Financials are based on the most recent Mortgage that was taken out on this home.
Original Mortgage
$380,000
Outstanding Balance
$202,576
Interest Rate
5.99%
Mortgage Type
Purchase Money Mortgage
Estimated Equity
$578,691
Purchase Details
Closed on
Jun 11, 1997
Sold by
Bouwman William and Bouwman Tjettje
Bought by
Richardson John P and Richardson Rebecca E
Home Financials for this Owner
Home Financials are based on the most recent Mortgage that was taken out on this home.
Original Mortgage
$140,760
Interest Rate
7.58%
Mortgage Type
VA
Create a Home Valuation Report for This Property
The Home Valuation Report is an in-depth analysis detailing your home's value as well as a comparison with similar homes in the area
Home Values in the Area
Average Home Value in this Area
Purchase History
| Date | Buyer | Sale Price | Title Company |
|---|---|---|---|
| Frias Joseph A | $475,000 | First American Title Company | |
| Richardson John P | $138,000 | First American Title Ins Co |
Source: Public Records
Mortgage History
| Date | Status | Borrower | Loan Amount |
|---|---|---|---|
| Open | Frias Joseph A | $380,000 | |
| Previous Owner | Richardson John P | $140,760 |
Source: Public Records
Tax History Compared to Growth
Tax History
| Year | Tax Paid | Tax Assessment Tax Assessment Total Assessment is a certain percentage of the fair market value that is determined by local assessors to be the total taxable value of land and additions on the property. | Land | Improvement |
|---|---|---|---|---|
| 2025 | $7,038 | $649,129 | $227,195 | $421,934 |
| 2024 | $7,038 | $636,401 | $222,740 | $413,661 |
| 2023 | $6,843 | $623,923 | $218,373 | $405,550 |
| 2022 | $6,618 | $595,000 | $208,000 | $387,000 |
| 2021 | $5,788 | $520,000 | $182,000 | $338,000 |
| 2020 | $5,342 | $481,100 | $170,000 | $311,100 |
| 2019 | $5,197 | $467,000 | $165,000 | $302,000 |
| 2018 | $4,608 | $414,900 | $144,600 | $270,300 |
| 2017 | $4,295 | $385,900 | $134,500 | $251,400 |
| 2016 | $3,900 | $367,500 | $128,100 | $239,400 |
| 2015 | $3,696 | $350,000 | $122,000 | $228,000 |
| 2014 | $3,548 | $336,000 | $118,000 | $218,000 |
Source: Public Records
Map
Nearby Homes
- 12524 Ross Ave
- 6016 Harrison St
- 2321 S Magnolia Ave Unit 6E
- 1135 W Whittlers Ln Unit 49
- 1162 W Philadelphia St
- 12811 Oaks Ave
- 12351 Twin Gables Dr
- 2142 S Mountain Ave
- 12796 17th St
- 5641 Buckthorn Ct
- 2064 S Magnolia Ave
- 12689 Cypress Ave
- 5610 Guardian Way
- 926 W Philadelphia St Unit R99
- 926 W Philadelphia St Unit 18
- 926 W Philadelphia St Unit 10
- 6542 Hamilton St
- 5925 Riverside Dr Unit 12
- 6061 Barbara St
- 6667 King St
- 6110 Walnut Ave
- 6111 Garfield St
- 6116 Walnut Ave
- 6086 Walnut Ave
- 6133 Garfield St
- 12460 Magnolia Ave
- 12511 Magnolia Ave
- 6124 Walnut Ave
- 6076 Walnut Ave
- 6119 Walnut Ave
- 6075 Garfield St
- 6143 Garfield St
- 6079 Walnut Ave
- 6070 Walnut Ave
- 6130 Walnut Ave
- 6066 Walnut Ave
- 12531 Magnolia Ave
- 6065 Garfield St
- 6153 Garfield St
- 6112 Garfield St