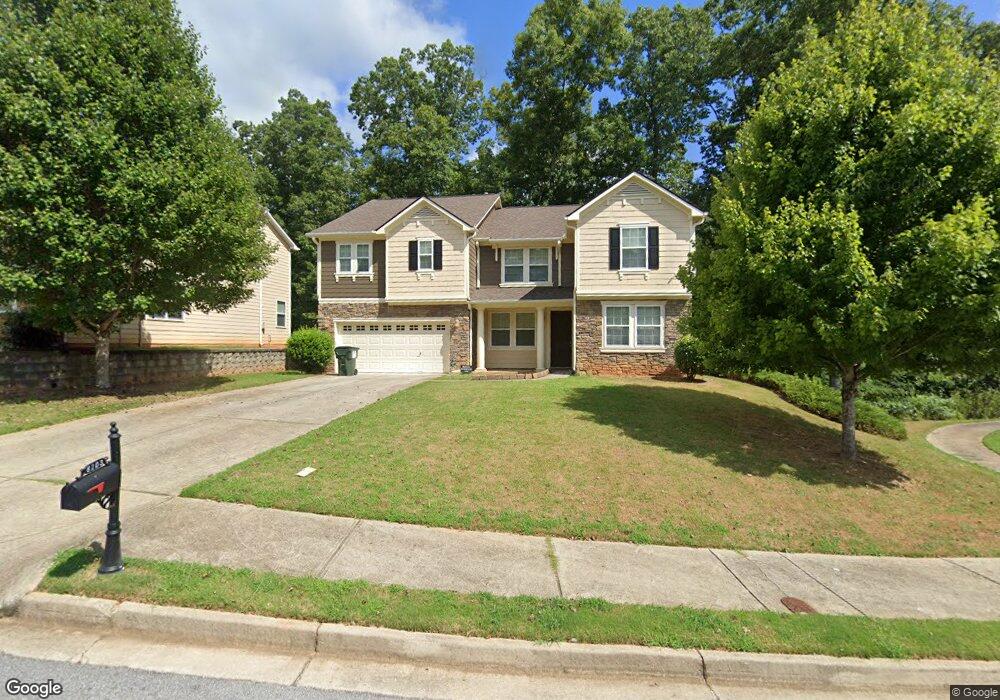
6103 Chastain Way Fairburn, GA 30213
Estimated Value: $348,000 - $875,000
4
Beds
3
Baths
2,180
Sq Ft
$246/Sq Ft
Est. Value
About This Home
This home is located at 6103 Chastain Way, Fairburn, GA 30213 and is currently estimated at $535,400, approximately $245 per square foot. 6103 Chastain Way is a home located in Fulton County with nearby schools including Renaissance Elementary School, Renaissance Middle School, and Langston Hughes High School.
Ownership History
Date
Name
Owned For
Owner Type
Purchase Details
Closed on
Jan 10, 2012
Sold by
Federal National Mortgage Association
Bought by
Thomas Richard
Current Estimated Value
Home Financials for this Owner
Home Financials are based on the most recent Mortgage that was taken out on this home.
Original Mortgage
$121,733
Outstanding Balance
$84,526
Interest Rate
4.25%
Mortgage Type
FHA
Estimated Equity
$450,874
Purchase Details
Closed on
Jan 13, 2011
Sold by
Chase Hm Fin Llc
Bought by
Federal Natl Mtg Assn Fnma
Purchase Details
Closed on
Dec 7, 2010
Sold by
Williams Larry
Bought by
Chase Hm Fin Llc
Purchase Details
Closed on
Jul 27, 2007
Sold by
Kb Home Atlanta Llc
Bought by
Williams Larry
Home Financials for this Owner
Home Financials are based on the most recent Mortgage that was taken out on this home.
Original Mortgage
$215,000
Interest Rate
6.65%
Mortgage Type
New Conventional
Create a Home Valuation Report for This Property
The Home Valuation Report is an in-depth analysis detailing your home's value as well as a comparison with similar homes in the area
Home Values in the Area
Average Home Value in this Area
Purchase History
| Date | Buyer | Sale Price | Title Company |
|---|---|---|---|
| Thomas Richard | $124,900 | -- | |
| Federal Natl Mtg Assn Fnma | -- | -- | |
| Chase Hm Fin Llc | $249,997 | -- | |
| Williams Larry | $215,000 | -- |
Source: Public Records
Mortgage History
| Date | Status | Borrower | Loan Amount |
|---|---|---|---|
| Open | Thomas Richard | $121,733 | |
| Previous Owner | Williams Larry | $215,000 |
Source: Public Records
Tax History Compared to Growth
Tax History
| Year | Tax Paid | Tax Assessment Tax Assessment Total Assessment is a certain percentage of the fair market value that is determined by local assessors to be the total taxable value of land and additions on the property. | Land | Improvement |
|---|---|---|---|---|
| 2025 | $2,128 | $127,320 | $28,960 | $98,360 |
| 2023 | $3,735 | $132,320 | $34,720 | $97,600 |
| 2022 | $1,996 | $96,440 | $18,320 | $78,120 |
| 2021 | $1,951 | $76,800 | $16,240 | $60,560 |
| 2020 | $1,945 | $75,880 | $16,040 | $59,840 |
| 2019 | $1,988 | $70,440 | $16,640 | $53,800 |
| 2018 | $1,781 | $65,320 | $15,840 | $49,480 |
| 2017 | $1,759 | $65,240 | $23,480 | $41,760 |
| 2016 | $1,643 | $65,240 | $23,480 | $41,760 |
| 2015 | $1,647 | $65,240 | $23,480 | $41,760 |
| 2014 | $1,470 | $54,240 | $10,440 | $43,800 |
Source: Public Records
Map
Nearby Homes
- 6164 Chastain Way
- 515 Lakeside View
- 7314 Parkland Bend
- 6066 Allpoint Way Unit 3
- 539 Greyhawk Way
- 6127 Landers Loop
- 782 Jasperson Ct Unit 46
- 7565 Jennadee Dr
- 7729 Waterlace Dr
- 7299 St Agnes Way
- 5745 Village Loop
- 7789 Village Pass
- 7369 Saint Peter Way
- 7365 Saint Peter Way
- 8004 Larksview Dr
- 6509 Lily Trail
- 7497 Spoleto Loop
- 8030 Snapwell Dr
- 7946 Gossamer Dr
- 7980 Cedar Grove Rd
- 6107 Chastain Way
- 6108 Chastain Way
- 6111 Chastain Way
- 6104 Chastain Way
- 6112 Chastain Way Unit 1
- 6100 Chastain Way
- 6099 Chastain Way
- 6116 Chastain Way
- 6115 Chastain Way
- 6115 Chastain Way
- 6096 Chastain Way Unit 1
- 715 Kirkly Way
- 725 Kirkly Way
- 735 Kirkly Way
- 6124 Chastain Way
- 6119 Chastain Way
- 745 Kirkly Way
- 705 Kirkly Way Unit 1
- 6132 Chastain Way
- 6123 Chastain Way