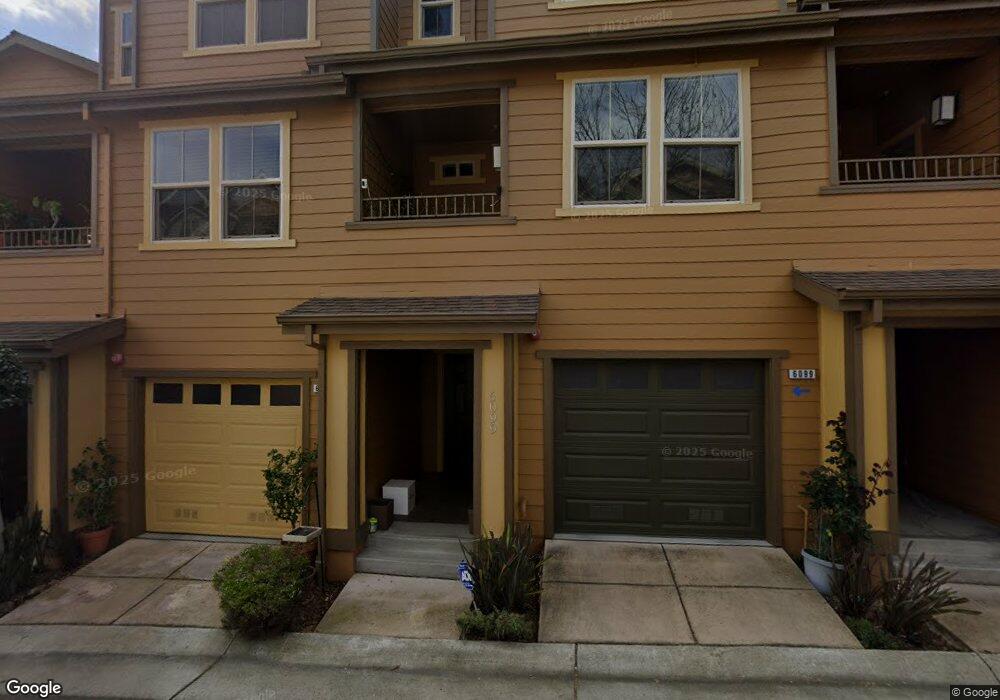
6103 Old Quarry Loop Unit 4101 Oakland, CA 94605
Caballo Hills NeighborhoodEstimated Value: $464,000 - $647,000
2
Beds
2
Baths
1,178
Sq Ft
$453/Sq Ft
Est. Value
About This Home
This home is located at 6103 Old Quarry Loop Unit 4101, Oakland, CA 94605 and is currently estimated at $533,374, approximately $452 per square foot. 6103 Old Quarry Loop Unit 4101 is a home located in Alameda County with nearby schools including Burckhalter Elementary School, Frick United Academy of Language, and Skyline High School.
Ownership History
Date
Name
Owned For
Owner Type
Purchase Details
Closed on
Jan 3, 2012
Sold by
Bank Of America Na
Bought by
Beeson Deanna
Current Estimated Value
Home Financials for this Owner
Home Financials are based on the most recent Mortgage that was taken out on this home.
Original Mortgage
$206,984
Interest Rate
3.92%
Mortgage Type
FHA
Purchase Details
Closed on
Jun 23, 2011
Sold by
Scheerer Adolfo
Bought by
Bank Of America Na
Purchase Details
Closed on
Sep 14, 2007
Sold by
Leona Llc
Bought by
Scheerer Adolfo
Home Financials for this Owner
Home Financials are based on the most recent Mortgage that was taken out on this home.
Original Mortgage
$520,000
Interest Rate
6.75%
Mortgage Type
Purchase Money Mortgage
Create a Home Valuation Report for This Property
The Home Valuation Report is an in-depth analysis detailing your home's value as well as a comparison with similar homes in the area
Home Values in the Area
Average Home Value in this Area
Purchase History
| Date | Buyer | Sale Price | Title Company |
|---|---|---|---|
| Beeson Deanna | $212,500 | Landsafe Title Of California | |
| Bank Of America Na | $202,500 | Landsafe | |
| Scheerer Adolfo | $650,000 | Old Republic Title Company |
Source: Public Records
Mortgage History
| Date | Status | Borrower | Loan Amount |
|---|---|---|---|
| Previous Owner | Beeson Deanna | $206,984 | |
| Previous Owner | Scheerer Adolfo | $520,000 |
Source: Public Records
Tax History
| Year | Tax Paid | Tax Assessment Tax Assessment Total Assessment is a certain percentage of the fair market value that is determined by local assessors to be the total taxable value of land and additions on the property. | Land | Improvement |
|---|---|---|---|---|
| 2025 | $5,091 | $266,645 | $79,880 | $186,765 |
| 2024 | $5,091 | $261,419 | $78,315 | $183,104 |
| 2023 | $5,262 | $256,294 | $76,779 | $179,515 |
| 2022 | $5,076 | $251,269 | $75,274 | $175,995 |
| 2021 | $4,749 | $246,343 | $73,798 | $172,545 |
| 2020 | $5,065 | $243,819 | $73,042 | $170,777 |
| 2019 | $6,978 | $239,041 | $71,611 | $167,430 |
| 2018 | $6,799 | $234,355 | $70,207 | $164,148 |
| 2017 | $6,299 | $229,761 | $68,831 | $160,930 |
| 2016 | $5,490 | $225,256 | $67,481 | $157,775 |
| 2015 | $5,759 | $221,874 | $66,468 | $155,406 |
| 2014 | $5,215 | $217,528 | $65,166 | $152,362 |
Source: Public Records
Map
Nearby Homes
- 6020 Old Quarry Loop
- 6271 Rocky Point Ct
- 6067 Old Quarry Loop Unit 4306
- 6246 Boulder Ln Unit 4807
- 6299 Rocky Point Ct
- 6466 Bayview Dr
- 6440 Sunnymere Ave
- 3920 Edgemoor Place
- 6927 Sunkist Dr
- 13367 Campus Dr
- 6401 Leona St
- 7333 Sunkist Dr
- 4903 Stoneridge Ct
- 6871 Simson St
- 6400 Mokelumne Ave
- 7106 Outlook Ave
- 4200 Mountain View Ave
- 6208 Oakdale Ave
- 6193 Oakdale Ave
- 7565 Hillmont Dr
- 6103 Old Quarry Loop
- 6105 Old Quarry Loop
- 6103 Old Quarry Loop Unit 4102
- 6099 Old Quarry Loop
- 6097 Old Quarry Loop
- 6093 Old Quarry Loop
- 6095 Old Quarry Loop
- 6101 Old Quarry Loop
- 304 Old Quarry Loop Unit 6032
- 6037 Old Quarry Loop
- 6035 Old Quarry Loop
- 6039 Old Quarry Loop
- 6033 Old Quarry Loop
- 6041 Old Quarry Loop
- 6031 Old Quarry Loop
- 6162 Old Quarry Loop
- 6176 Old Quarry Loop
- 6160 Old Quarry Loop Unit 4609
- 6164 Old Quarry Loop
- 6168 Old Quarry Loop
Your Personal Tour Guide
Ask me questions while you tour the home.