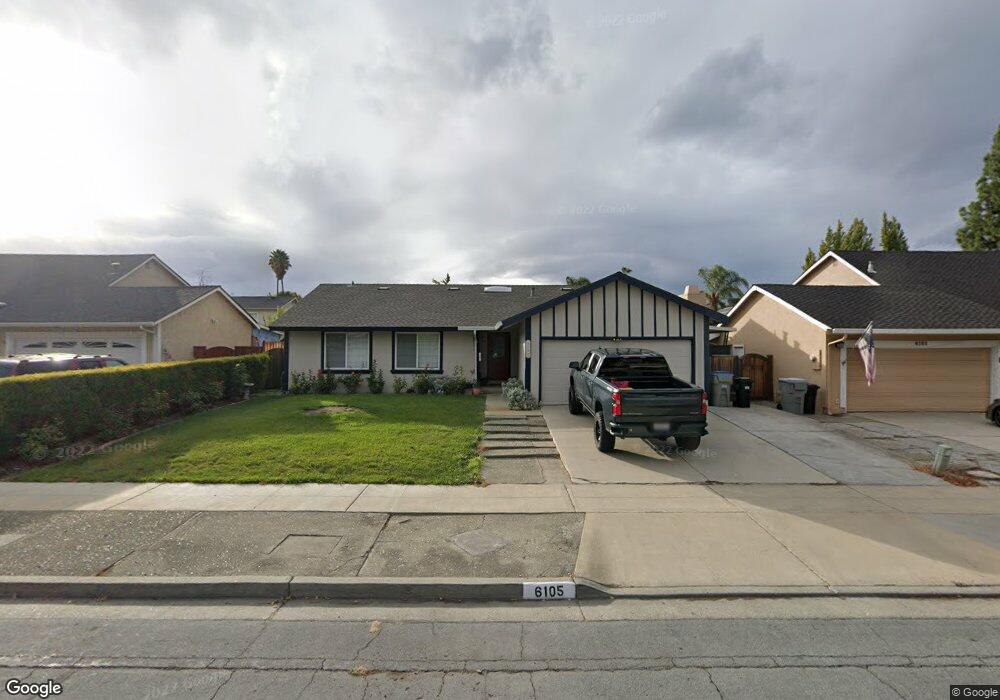
6105 Hutton Ct San Jose, CA 95123
Santa Teresa Foothills NeighborhoodEstimated Value: $1,461,213 - $1,555,000
4
Beds
2
Baths
1,410
Sq Ft
$1,078/Sq Ft
Est. Value
About This Home
This home is located at 6105 Hutton Ct, San Jose, CA 95123 and is currently estimated at $1,519,303, approximately $1,077 per square foot. 6105 Hutton Ct is a home located in Santa Clara County with nearby schools including Bertha Taylor Elementary School, Bernal Intermediate School, and Santa Teresa High School.
Ownership History
Date
Name
Owned For
Owner Type
Purchase Details
Closed on
Jun 14, 2002
Sold by
Taslimi Nader
Bought by
Taslimi Nader
Current Estimated Value
Home Financials for this Owner
Home Financials are based on the most recent Mortgage that was taken out on this home.
Original Mortgage
$220,000
Outstanding Balance
$92,560
Interest Rate
6.74%
Estimated Equity
$1,426,743
Purchase Details
Closed on
Jun 12, 2002
Sold by
Mchaney William R and Mchaney Pamela L
Bought by
Taslimi Nader
Home Financials for this Owner
Home Financials are based on the most recent Mortgage that was taken out on this home.
Original Mortgage
$220,000
Outstanding Balance
$92,560
Interest Rate
6.74%
Estimated Equity
$1,426,743
Purchase Details
Closed on
Mar 22, 2001
Sold by
Mchaney William R and Mchaney Pamela L
Bought by
Mchaney William R and Mchaney Pamela L
Home Financials for this Owner
Home Financials are based on the most recent Mortgage that was taken out on this home.
Original Mortgage
$267,000
Interest Rate
7.19%
Purchase Details
Closed on
Jul 27, 1999
Sold by
Mchaney William R and Mchaney Pamela L
Bought by
Mchaney William R and Mchaney Pamela L
Create a Home Valuation Report for This Property
The Home Valuation Report is an in-depth analysis detailing your home's value as well as a comparison with similar homes in the area
Home Values in the Area
Average Home Value in this Area
Purchase History
| Date | Buyer | Sale Price | Title Company |
|---|---|---|---|
| Taslimi Nader | -- | Alliance Title Company | |
| Taslimi Nader | $475,000 | Alliance Title Company | |
| Mchaney William R | -- | Stewart Title | |
| Mchaney William R | -- | -- |
Source: Public Records
Mortgage History
| Date | Status | Borrower | Loan Amount |
|---|---|---|---|
| Open | Taslimi Nader | $220,000 | |
| Previous Owner | Mchaney William R | $267,000 |
Source: Public Records
Tax History Compared to Growth
Tax History
| Year | Tax Paid | Tax Assessment Tax Assessment Total Assessment is a certain percentage of the fair market value that is determined by local assessors to be the total taxable value of land and additions on the property. | Land | Improvement |
|---|---|---|---|---|
| 2025 | $10,098 | $701,693 | $315,684 | $386,009 |
| 2024 | $10,098 | $687,936 | $309,495 | $378,441 |
| 2023 | $9,936 | $674,448 | $303,427 | $371,021 |
| 2022 | $9,876 | $661,225 | $297,478 | $363,747 |
| 2021 | $9,722 | $648,261 | $291,646 | $356,615 |
| 2020 | $9,504 | $641,615 | $288,656 | $352,959 |
| 2019 | $9,281 | $629,036 | $282,997 | $346,039 |
| 2018 | $9,215 | $616,703 | $277,449 | $339,254 |
| 2017 | $9,092 | $604,611 | $272,009 | $332,602 |
| 2016 | $8,653 | $592,757 | $266,676 | $326,081 |
| 2015 | $8,457 | $583,854 | $262,671 | $321,183 |
| 2014 | $7,730 | $572,418 | $257,526 | $314,892 |
Source: Public Records
Map
Nearby Homes
- 406 Madison Dr
- 401 Henderson Dr
- 6129 Glen Harbor Dr
- 471 Tovar Dr
- 6239 Mahan Dr
- 6273 Mountford Dr
- 497 Curie Dr
- 415 Conestoga Way
- 343 Nature Dr
- 5991 Sorrel Ave
- 5865 Paddon Cir
- 6449 Curie Ct
- 379 Roan St
- 529 Galen Dr
- 5967 Shawcroft Dr
- 404 Ariel Dr
- 0 Deer Valley Rd Unit 225017975
- 6441 Cottle Rd
- 5780 Herma St
- 482 Calero Ave