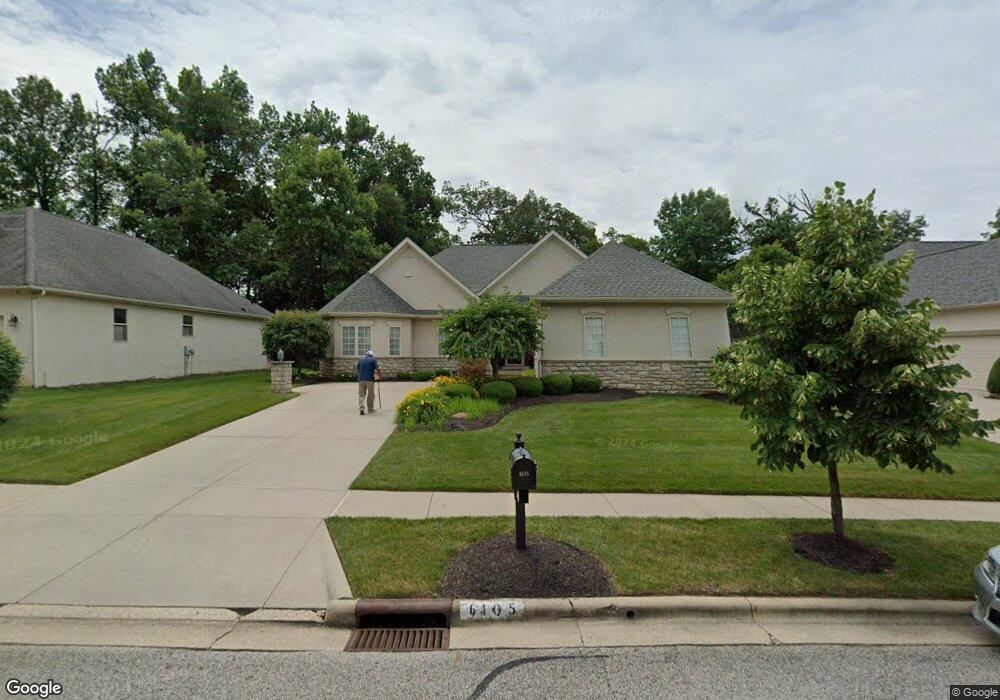
6105 Nicholas Glen Columbus, OH 43213
Olde Orchard NeighborhoodEstimated Value: $447,604 - $570,000
2
Beds
4
Baths
2,442
Sq Ft
$207/Sq Ft
Est. Value
About This Home
This home is located at 6105 Nicholas Glen, Columbus, OH 43213 and is currently estimated at $506,401, approximately $207 per square foot. 6105 Nicholas Glen is a home located in Franklin County with nearby schools including Olde Orchard Elementary School, Sherwood Middle School, and Walnut Ridge High School.
Ownership History
Date
Name
Owned For
Owner Type
Purchase Details
Closed on
Dec 17, 1999
Sold by
Camelot Custom Builders Inc
Bought by
Bell Leroy A and Bell Evelyn W
Current Estimated Value
Home Financials for this Owner
Home Financials are based on the most recent Mortgage that was taken out on this home.
Original Mortgage
$260,900
Interest Rate
7.7%
Purchase Details
Closed on
Jun 10, 1999
Sold by
Morrone Okeefe Mcnaughten Road Developme
Bought by
Camelot Custom Builders Inc
Home Financials for this Owner
Home Financials are based on the most recent Mortgage that was taken out on this home.
Original Mortgage
$209,000
Interest Rate
6.99%
Mortgage Type
Construction
Create a Home Valuation Report for This Property
The Home Valuation Report is an in-depth analysis detailing your home's value as well as a comparison with similar homes in the area
Home Values in the Area
Average Home Value in this Area
Purchase History
| Date | Buyer | Sale Price | Title Company |
|---|---|---|---|
| Bell Leroy A | $307,000 | Franklin Abstract | |
| Camelot Custom Builders Inc | $50,000 | Franklin Abstract |
Source: Public Records
Mortgage History
| Date | Status | Borrower | Loan Amount |
|---|---|---|---|
| Previous Owner | Bell Leroy A | $260,900 | |
| Previous Owner | Camelot Custom Builders Inc | $209,000 |
Source: Public Records
Tax History Compared to Growth
Tax History
| Year | Tax Paid | Tax Assessment Tax Assessment Total Assessment is a certain percentage of the fair market value that is determined by local assessors to be the total taxable value of land and additions on the property. | Land | Improvement |
|---|---|---|---|---|
| 2024 | $6,480 | $154,180 | $40,990 | $113,190 |
| 2023 | $6,425 | $154,175 | $40,985 | $113,190 |
| 2022 | $5,192 | $108,850 | $28,770 | $80,080 |
| 2021 | $5,201 | $108,850 | $28,770 | $80,080 |
| 2020 | $5,208 | $108,850 | $28,770 | $80,080 |
| 2019 | $5,033 | $91,710 | $23,980 | $67,730 |
| 2018 | $5,339 | $91,710 | $23,980 | $67,730 |
| 2017 | $5,030 | $91,710 | $23,980 | $67,730 |
| 2016 | $6,230 | $102,800 | $21,600 | $81,200 |
| 2015 | $5,656 | $102,800 | $21,600 | $81,200 |
| 2014 | $5,669 | $102,800 | $21,600 | $81,200 |
| 2013 | $3,136 | $114,240 | $24,010 | $90,230 |
Source: Public Records
Map
Nearby Homes
- 6033 McNaughten Grove Ln
- Oxford Plan at Icon Villas at McNaughten
- Ashton Plan at Icon Villas at McNaughten
- 6040 Naughten Pond Dr
- 6052 Naughten Pond Dr
- 6056 Naughten Pond Dr
- 5882 Timber Dr
- 5850 Forestview Dr
- 541 Woodingham Place Unit 2-C
- 557 Woodingham Place Unit 1A
- 187 McNaughten Rd
- 5613 Chowning Way Unit 6B
- 6279 Braiden Ct Unit 10B
- 807 McNaughten Rd
- 6193 Stornoway Dr S Unit 6193
- 6231 Peach Tree Rd
- 85 Stornoway Dr W Unit 85
- 6258 Peach Tree Rd
- 856 Cummington Rd
- 6198 Stornoway Dr S Unit 6198
- 6097 Nicholas Glen
- 6113 Nicholas Glen
- 6113 Nicholas Glen Unit G
- 6121 Nicholas Glen
- 6089 Nicholas Glen
- 6082 McNaughten Grove Ln
- 6086 McNaughten Grove Ln
- 6078 McNaughten Grove Ln
- 6090 McNaughten Grove Ln
- 6074 McNaughten Grove Ln
- 6094 McNaughten Grove Ln
- 6070 McNaughten Grove Ln
- 6098 McNaughten Grove Ln
- 6081 Nicholas Glen
- 6104 Nicholas Glen
- 6066 McNaughten Grove Ln
- 6102 McNaughten Grove Ln
- 6112 Nicholas Glen
- 6096 Nicholas Glen
- 6096 Nicholas Glen Unit REL