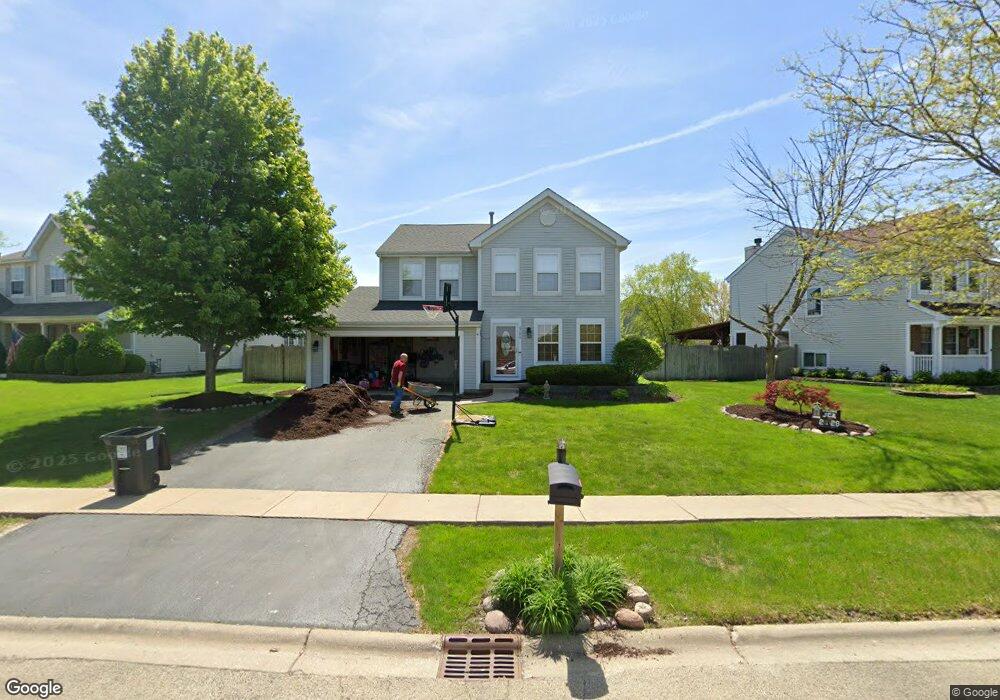
6106 Pheasant Ridge Dr Unit 1 Plainfield, IL 60586
Fall Creek NeighborhoodEstimated Value: $365,474 - $404,000
--
Bed
1
Bath
1,900
Sq Ft
$204/Sq Ft
Est. Value
About This Home
This home is located at 6106 Pheasant Ridge Dr Unit 1, Plainfield, IL 60586 and is currently estimated at $387,369, approximately $203 per square foot. 6106 Pheasant Ridge Dr Unit 1 is a home located in Will County with nearby schools including Ridge Elementary School, Drauden Point Middle School, and Plainfield South High School.
Ownership History
Date
Name
Owned For
Owner Type
Purchase Details
Closed on
Dec 3, 2010
Sold by
Jurica Jay M and Jurica Lynda S
Bought by
Oetter James and Oetter Brigitte Lynn
Current Estimated Value
Home Financials for this Owner
Home Financials are based on the most recent Mortgage that was taken out on this home.
Original Mortgage
$158,332
Outstanding Balance
$104,660
Interest Rate
4.23%
Mortgage Type
VA
Estimated Equity
$282,709
Purchase Details
Closed on
Feb 28, 2002
Sold by
William Ryan Homes Inc
Bought by
Jurica Jay M and Jurica Lynda S
Home Financials for this Owner
Home Financials are based on the most recent Mortgage that was taken out on this home.
Original Mortgage
$144,000
Interest Rate
6.93%
Create a Home Valuation Report for This Property
The Home Valuation Report is an in-depth analysis detailing your home's value as well as a comparison with similar homes in the area
Home Values in the Area
Average Home Value in this Area
Purchase History
| Date | Buyer | Sale Price | Title Company |
|---|---|---|---|
| Oetter James | $155,000 | Chicago Title Insurance Co | |
| Jurica Jay M | $180,500 | Ticor Title |
Source: Public Records
Mortgage History
| Date | Status | Borrower | Loan Amount |
|---|---|---|---|
| Open | Oetter James | $158,332 | |
| Previous Owner | Jurica Jay M | $144,000 |
Source: Public Records
Tax History Compared to Growth
Tax History
| Year | Tax Paid | Tax Assessment Tax Assessment Total Assessment is a certain percentage of the fair market value that is determined by local assessors to be the total taxable value of land and additions on the property. | Land | Improvement |
|---|---|---|---|---|
| 2024 | $6,772 | $107,553 | $24,056 | $83,497 |
| 2023 | $6,772 | $97,140 | $21,727 | $75,413 |
| 2022 | $6,433 | $91,399 | $20,443 | $70,956 |
| 2021 | $5,956 | $85,420 | $19,106 | $66,314 |
| 2020 | $5,853 | $82,997 | $18,564 | $64,433 |
| 2019 | $5,627 | $79,082 | $17,688 | $61,394 |
| 2018 | $5,356 | $74,302 | $16,619 | $57,683 |
| 2017 | $5,170 | $70,609 | $15,793 | $54,816 |
| 2016 | $5,488 | $67,342 | $15,062 | $52,280 |
| 2015 | $5,117 | $63,084 | $14,110 | $48,974 |
| 2014 | $5,117 | $60,857 | $13,612 | $47,245 |
| 2013 | $5,117 | $60,857 | $13,612 | $47,245 |
Source: Public Records
Map
Nearby Homes
- 2115 Stafford Ct Unit 3
- 2015 Brunswick Dr
- 6304 Southridge Dr
- 1615 Caton Ridge Dr
- 6407 Coyote Ridge Ct
- 2042 Legacy Pointe Blvd
- 1605 Heritage Pointe Ct
- 1910 Arbor Fields Dr
- 2045 Winding Lakes Dr
- 6113 Oldcreek Ln
- 1514 Spring Oaks Dr
- 0 Theodore St
- 0001 S State Route 59
- 0002 S State Route 59
- 1603 Valley Ridge Dr
- 1891 Westmore Grove Dr
- 1810 Legacy Pointe Blvd
- 1407 Prairie Creek Trail
- 25110 W Catherine Dr Unit 1
- 1804 Overland Dr
- 6104 Pheasant Ridge Dr Unit 1
- 6108 Pheasant Ridge Dr
- 2013 Fieldstone Ct
- 6102 Pheasant Ridge Dr
- 6110 Pheasant Ridge Dr
- 2011 Fieldstone Ct Unit 1
- 2014 Fieldstone Ct Unit 1
- 6111 Pheasant Ridge Dr
- 6107 Pheasant Ridge Dr
- 6113 Pheasant Ridge Dr Unit 1
- 6100 Pheasant Ridge Dr
- 6112 Pheasant Ridge Dr
- 6105 Pheasant Ridge Dr Unit 1
- 6115 Pheasant Ridge Dr
- 2012 Fieldstone Ct Unit 1
- 6103 Pheasant Ridge Dr
- 6117 Pheasant Ridge Dr Unit 1
- 6114 Pheasant Ridge Dr
- 6101 Pheasant Ridge Dr Unit 1
- 2007 Fieldstone Ct Unit 1