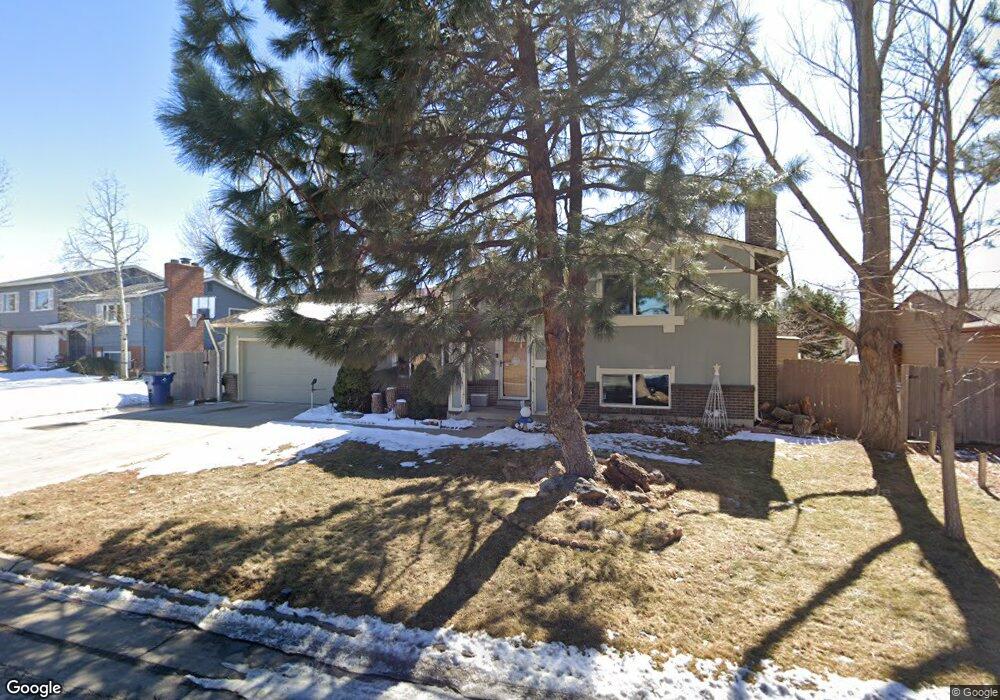
6106 W 86th Ave Arvada, CO 80003
Lake Arbor NeighborhoodEstimated Value: $526,182 - $603,000
4
Beds
2
Baths
1,936
Sq Ft
$296/Sq Ft
Est. Value
About This Home
This home is located at 6106 W 86th Ave, Arvada, CO 80003 and is currently estimated at $572,796, approximately $295 per square foot. 6106 W 86th Ave is a home located in Jefferson County with nearby schools including Noble Avenue Elementary School, Moore Middle School, and Pomona High School.
Ownership History
Date
Name
Owned For
Owner Type
Purchase Details
Closed on
Feb 15, 2013
Sold by
Jennings John E and Jennings John Eric
Bought by
Granner Michael and Granner Marcy
Current Estimated Value
Home Financials for this Owner
Home Financials are based on the most recent Mortgage that was taken out on this home.
Original Mortgage
$228,533
Outstanding Balance
$155,711
Interest Rate
2.87%
Mortgage Type
FHA
Estimated Equity
$417,085
Purchase Details
Closed on
Jun 30, 2012
Sold by
Jennings John Eric and Langworthy Melinda Ann
Bought by
Jennings John Eric
Purchase Details
Closed on
Oct 4, 2006
Sold by
Spence Tracy S and Spence Sherri M
Bought by
Dennehy Melinda A and Jennings John E
Home Financials for this Owner
Home Financials are based on the most recent Mortgage that was taken out on this home.
Original Mortgage
$179,920
Interest Rate
6.47%
Mortgage Type
Purchase Money Mortgage
Create a Home Valuation Report for This Property
The Home Valuation Report is an in-depth analysis detailing your home's value as well as a comparison with similar homes in the area
Home Values in the Area
Average Home Value in this Area
Purchase History
| Date | Buyer | Sale Price | Title Company |
|---|---|---|---|
| Granner Michael | $232,750 | Land Title Guarantee Company | |
| Jennings John Eric | -- | None Available | |
| Dennehy Melinda A | $224,900 | Land Title |
Source: Public Records
Mortgage History
| Date | Status | Borrower | Loan Amount |
|---|---|---|---|
| Open | Granner Michael | $228,533 | |
| Previous Owner | Dennehy Melinda A | $179,920 |
Source: Public Records
Tax History Compared to Growth
Tax History
| Year | Tax Paid | Tax Assessment Tax Assessment Total Assessment is a certain percentage of the fair market value that is determined by local assessors to be the total taxable value of land and additions on the property. | Land | Improvement |
|---|---|---|---|---|
| 2024 | $2,865 | $29,532 | $11,654 | $17,878 |
| 2023 | $2,865 | $29,532 | $11,654 | $17,878 |
| 2022 | $2,515 | $25,678 | $8,213 | $17,465 |
| 2021 | $2,556 | $26,417 | $8,449 | $17,968 |
| 2020 | $2,327 | $24,115 | $7,661 | $16,454 |
| 2019 | $2,296 | $24,115 | $7,661 | $16,454 |
| 2018 | $2,087 | $21,314 | $6,436 | $14,878 |
| 2017 | $1,910 | $21,314 | $6,436 | $14,878 |
| 2016 | $1,863 | $19,575 | $5,422 | $14,153 |
| 2015 | $1,633 | $19,575 | $5,422 | $14,153 |
| 2014 | $1,633 | $16,127 | $5,126 | $11,001 |
Source: Public Records
Map
Nearby Homes
- 8598 Ingalls Cir
- 8597 Gray St
- 8536 Eaton St
- 8445 Lamar Dr
- 8506 Eaton St
- 9066 Harlan St
- 8762 Pierce Way Unit 120
- 8742 Pierce Way Unit 129
- 5735 W 91st Place
- 8397 Chase Dr
- 8781 Pierce Way Unit 102
- 8423 Chase St
- 6545 W 84th Way Unit 124
- 8390 Quay Dr
- 6655 W 84th Way Unit 90
- 6725 W 84th Way Unit 72
- 8389 Benton Way
- 6941 W 87th Way Unit 294
- 8438 Ames St
- 8784 Chase Dr Unit 32
- 6136 W 86th Ave
- 6076 W 86th Ave
- 8572 Ingalls Cir
- 6166 W 86th Ave
- 6046 W 86th Ave
- 8578 Ingalls Cir
- 8568 Ingalls Cir
- 6067 W 86th Ave
- 6097 W 86th Ave
- 6196 W 86th Ave
- 6037 W 86th Ave
- 8588 Ingalls Cir
- 6187 W 86th Ave
- 8562 Ingalls Cir
- 8582 Ingalls Cir
- 6226 W 86th Ave
- 6157 W 86th Ave
- 6127 W 86th Ave
- 8592 Ingalls Cir
- 5985 W 86th Ave