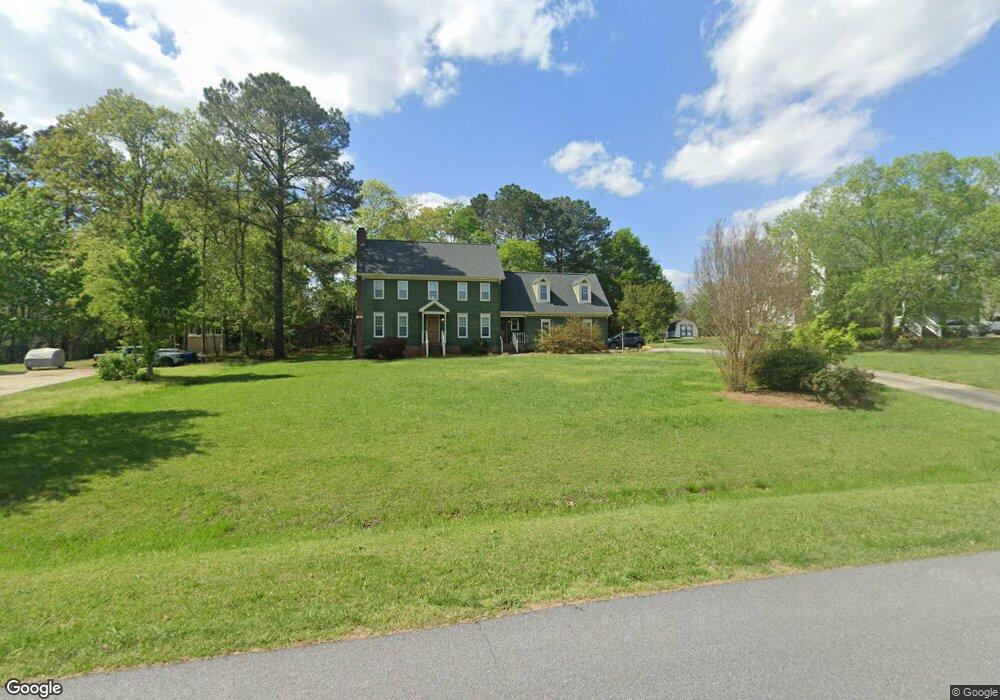
6108 Wolverhampton Dr Raleigh, NC 27603
South Raleigh NeighborhoodEstimated Value: $452,000 - $494,000
3
Beds
3
Baths
2,456
Sq Ft
$191/Sq Ft
Est. Value
About This Home
This home is located at 6108 Wolverhampton Dr, Raleigh, NC 27603 and is currently estimated at $468,366, approximately $190 per square foot. 6108 Wolverhampton Dr is a home located in Wake County with nearby schools including Rand Road Elementary, North Garner Middle, and Garner High.
Ownership History
Date
Name
Owned For
Owner Type
Purchase Details
Closed on
May 29, 2020
Sold by
Craig Marlo L and Craig Richard Douglas
Bought by
Macconnell Caroline and Macconnell Forrest
Current Estimated Value
Home Financials for this Owner
Home Financials are based on the most recent Mortgage that was taken out on this home.
Original Mortgage
$314,000
Outstanding Balance
$284,083
Interest Rate
4.37%
Mortgage Type
New Conventional
Estimated Equity
$184,283
Purchase Details
Closed on
Oct 30, 2014
Sold by
Morton William S and Morton June P
Bought by
Belliam Property Solutions Inc
Home Financials for this Owner
Home Financials are based on the most recent Mortgage that was taken out on this home.
Original Mortgage
$144,500
Interest Rate
4.29%
Mortgage Type
Commercial
Create a Home Valuation Report for This Property
The Home Valuation Report is an in-depth analysis detailing your home's value as well as a comparison with similar homes in the area
Home Values in the Area
Average Home Value in this Area
Purchase History
| Date | Buyer | Sale Price | Title Company |
|---|---|---|---|
| Macconnell Caroline | $312,000 | None Available | |
| Belliam Property Solutions Inc | $170,000 | None Available |
Source: Public Records
Mortgage History
| Date | Status | Borrower | Loan Amount |
|---|---|---|---|
| Open | Macconnell Caroline | $314,000 | |
| Previous Owner | Belliam Property Solutions Inc | $144,500 |
Source: Public Records
Tax History
| Year | Tax Paid | Tax Assessment Tax Assessment Total Assessment is a certain percentage of the fair market value that is determined by local assessors to be the total taxable value of land and additions on the property. | Land | Improvement |
|---|---|---|---|---|
| 2025 | $2,756 | $427,801 | $80,000 | $347,801 |
| 2024 | $2,677 | $427,801 | $80,000 | $347,801 |
Source: Public Records
Map
Nearby Homes
- 5824 Carriage Gate Dr
- 1025 Azalea Garden Cir
- 1245 Azalea Garden Cir
- 1024 Azalea Garden Cir
- 1233 Azalea Garden Cir
- 1037 Azalea Garden Cir
- 6220 Standing Oak Ln
- 1028 Azalea Garden Cir
- 1057 Azalea Garden Cir
- 1217 Azalea Garden Cir
- 1061 Azalea Garden Cir
- 6501 Rock Service Station Rd
- 1065 Azalea Garden Cir
- 1069 Azalea Garden Cir
- 6801 Rock Service Station Rd
- 6512 Cablewood Dr
- 1145 Taos Trail
- 1320 Greenbranch Ln
- 1005 Turner Meadow Dr
- 1224 Turner Woods Dr
- 6104 Wolverhampton Dr
- 6112 Wolverhampton Dr
- 5941 Hampton Ridge Rd
- 6020 Wolverhampton Dr
- 5937 Hampton Ridge Rd
- 6109 Wolverhampton Dr
- 5945 Hampton Ridge Rd
- 5933 Hampton Ridge Rd
- 6120 Wolverhampton Dr
- 1525 Ramson Ct
- 6016 Wolverhampton Dr
- 6121 Wolverhampton Dr
- 5929 Hampton Ridge Rd
- 6001 Hampton Ridge Rd
- 6124 Wolverhampton Dr
- 6013 Wolverhampton Dr
- 6012 Wolverhampton Dr
- 6129 Wolverhampton Dr
- 5925 Hampton Ridge Rd
- 6009 Hampton Ridge Rd
Your Personal Tour Guide
Ask me questions while you tour the home.