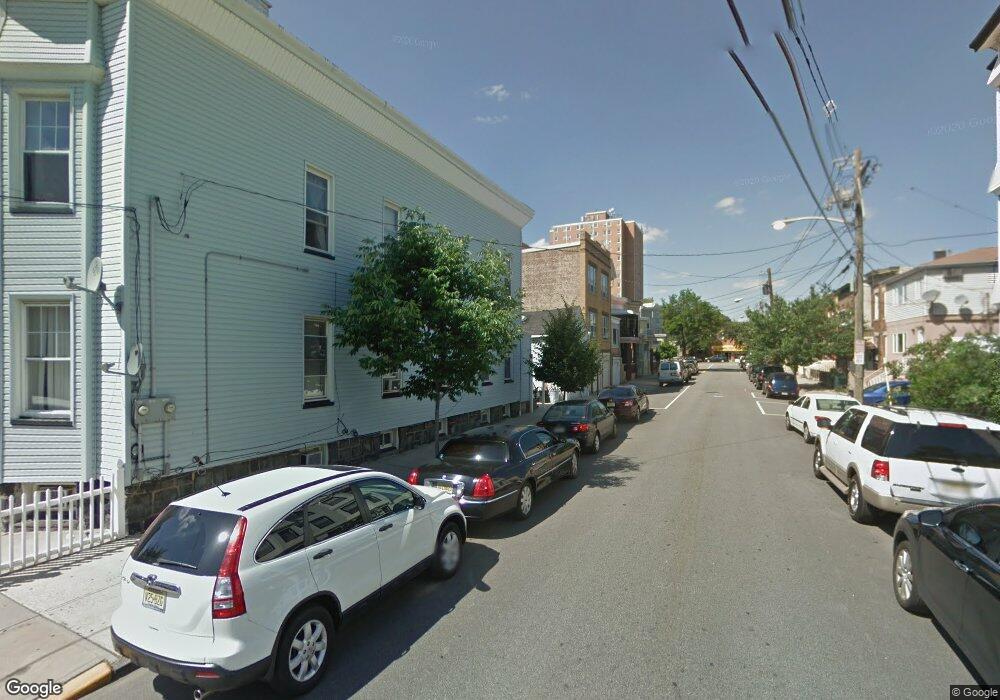
6109 Tyler Place West New York, NJ 07093
Estimated Value: $641,557 - $900,000
--
Bed
--
Bath
2,400
Sq Ft
$321/Sq Ft
Est. Value
About This Home
This home is located at 6109 Tyler Place, West New York, NJ 07093 and is currently estimated at $770,639, approximately $321 per square foot. 6109 Tyler Place is a home located in Hudson County with nearby schools including Memorial High School and St. Joseph of the Palisades Elementary School.
Ownership History
Date
Name
Owned For
Owner Type
Purchase Details
Closed on
Oct 11, 2012
Sold by
Tufino Saul and Tufino Rebeca
Bought by
Tufino Saul
Current Estimated Value
Purchase Details
Closed on
Sep 14, 2006
Sold by
Blanco Javier L and Rodriguez Clariby
Bought by
Tufino Saul
Home Financials for this Owner
Home Financials are based on the most recent Mortgage that was taken out on this home.
Original Mortgage
$92,250
Interest Rate
6.22%
Mortgage Type
Stand Alone Second
Purchase Details
Closed on
Aug 28, 2003
Sold by
Garcia Tomas and Garcia Gladys
Bought by
Blanco Javier L and Rodriguez Clariby
Home Financials for this Owner
Home Financials are based on the most recent Mortgage that was taken out on this home.
Original Mortgage
$343,070
Interest Rate
6.31%
Mortgage Type
FHA
Purchase Details
Closed on
Aug 21, 1996
Sold by
Ge Capital Mtg Services Inc
Bought by
Garcia Tomas and Garcia Gladys
Purchase Details
Closed on
Feb 26, 1996
Sold by
Cassidy Joseph T
Bought by
G E Capital Mtg Services Inc
Create a Home Valuation Report for This Property
The Home Valuation Report is an in-depth analysis detailing your home's value as well as a comparison with similar homes in the area
Home Values in the Area
Average Home Value in this Area
Purchase History
| Date | Buyer | Sale Price | Title Company |
|---|---|---|---|
| Tufino Saul | -- | None Available | |
| Tufino Saul | $615,000 | None Available | |
| Blanco Javier L | $360,000 | -- | |
| Garcia Tomas | $145,000 | -- | |
| G E Capital Mtg Services Inc | -- | -- |
Source: Public Records
Mortgage History
| Date | Status | Borrower | Loan Amount |
|---|---|---|---|
| Closed | Tufino Saul | $92,250 | |
| Open | Tufino Saul | $492,000 | |
| Previous Owner | Blanco Javier L | $343,070 |
Source: Public Records
Tax History Compared to Growth
Tax History
| Year | Tax Paid | Tax Assessment Tax Assessment Total Assessment is a certain percentage of the fair market value that is determined by local assessors to be the total taxable value of land and additions on the property. | Land | Improvement |
|---|---|---|---|---|
| 2025 | $12,868 | $155,800 | $62,500 | $93,300 |
| 2024 | $12,363 | $155,800 | $62,500 | $93,300 |
| 2023 | $12,363 | $155,800 | $62,500 | $93,300 |
| 2022 | $12,093 | $155,800 | $62,500 | $93,300 |
| 2021 | $11,979 | $155,800 | $62,500 | $93,300 |
| 2020 | $11,895 | $155,800 | $62,500 | $93,300 |
| 2019 | $11,782 | $155,800 | $62,500 | $93,300 |
| 2018 | $11,727 | $155,800 | $62,500 | $93,300 |
| 2017 | $11,676 | $155,800 | $62,500 | $93,300 |
| 2016 | $11,373 | $155,800 | $62,500 | $93,300 |
| 2015 | $11,155 | $155,800 | $62,500 | $93,300 |
| 2014 | $10,426 | $155,800 | $62,500 | $93,300 |
Source: Public Records
Map
Nearby Homes
- 6031 Tyler Place
- 6118 Monroe Place
- 311 61st St
- 542 61st St
- 6314 Bway143-64th St Unit 4
- 5910 Palisade Ave
- 6406 Madison St
- 6307 Dewey Ave Unit 9
- 532 64th St
- 530 64th St
- 5901 Madison St
- 6511 Hudson Ave
- 563 59th St
- 420 57th St
- 6020 Broadway
- 6314 Broadway
- 415A 57th St
- 143 64th St
- 6203 Adams St
- 5707 Hudson Ave Unit 11
- 6111 Tyler Place
- 6113 Tyler Place
- 6115 Tyler Place
- 420 61st St
- 422 61st St Unit 204
- 422 61st St Unit 404
- 422 61st St
- 422 61st St Unit 403
- 422 61st St Unit 401
- 422 61st St Unit 402
- 422 61st St Unit 304
- 422 61st St Unit 303
- 422 61st St Unit 302
- 422 61st St Unit 203
- 422 61st St Unit 305
- 422 61st St Unit 405
- 422 61st St Unit 202
- 422 61st St Unit 201
- 428 61st St Unit 30
- 6108 Harrison Place