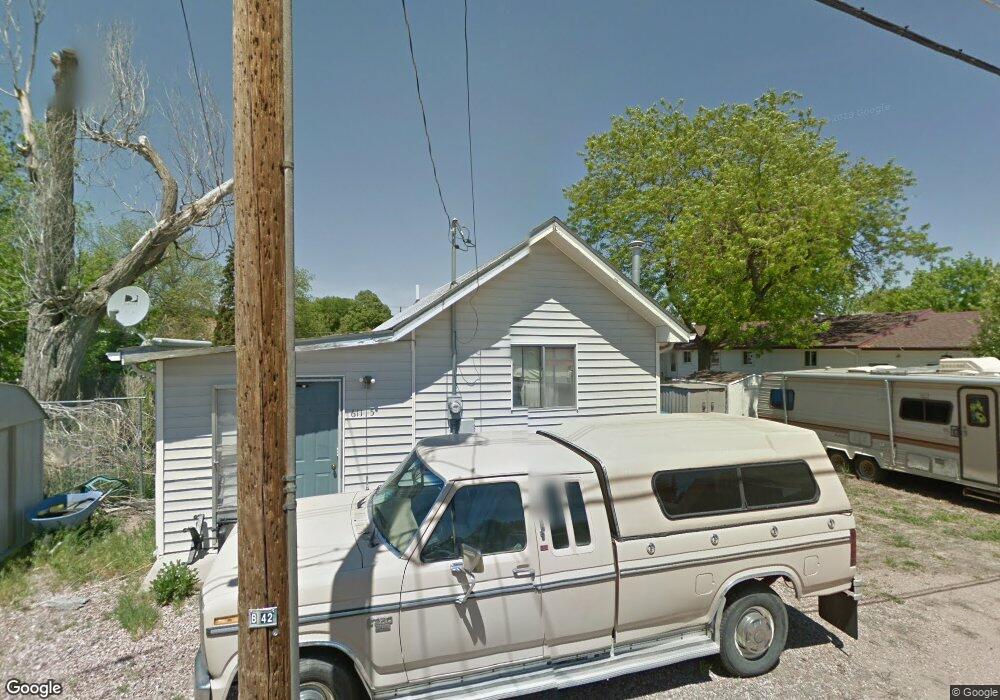
611 1/2 E B St Ogallala, NE 69153
Estimated Value: $97,052 - $166,000
1
Bed
2
Baths
545
Sq Ft
$227/Sq Ft
Est. Value
About This Home
This home is located at 611 1/2 E B St, Ogallala, NE 69153 and is currently estimated at $123,763, approximately $227 per square foot. 611 1/2 E B St is a home with nearby schools including Ogallala High School, St. Luke's Elementary School, and St. Paul's Lutheran School.
Ownership History
Date
Name
Owned For
Owner Type
Purchase Details
Closed on
Mar 15, 2024
Sold by
L & M Rentals Llc
Bought by
Asap Rentals Llc
Current Estimated Value
Purchase Details
Closed on
May 25, 2016
Sold by
Swanson Travis and Swanson Lois
Bought by
Huffman Mary E
Purchase Details
Closed on
May 17, 2008
Sold by
Reimers Bowe J
Bought by
Swanson Travis and Swanson Lois
Home Financials for this Owner
Home Financials are based on the most recent Mortgage that was taken out on this home.
Original Mortgage
$15,650
Interest Rate
5.89%
Mortgage Type
Future Advance Clause Open End Mortgage
Create a Home Valuation Report for This Property
The Home Valuation Report is an in-depth analysis detailing your home's value as well as a comparison with similar homes in the area
Home Values in the Area
Average Home Value in this Area
Purchase History
| Date | Buyer | Sale Price | Title Company |
|---|---|---|---|
| Asap Rentals Llc | $300,000 | Premier Abstract & Title | |
| Huffman Mary E | $23,000 | None Available | |
| Swanson Travis | $19,000 | None Available |
Source: Public Records
Mortgage History
| Date | Status | Borrower | Loan Amount |
|---|---|---|---|
| Previous Owner | Swanson Travis | $15,650 |
Source: Public Records
Tax History Compared to Growth
Tax History
| Year | Tax Paid | Tax Assessment Tax Assessment Total Assessment is a certain percentage of the fair market value that is determined by local assessors to be the total taxable value of land and additions on the property. | Land | Improvement |
|---|---|---|---|---|
| 2024 | $597 | $55,750 | $7,485 | $48,265 |
| 2023 | $685 | $49,105 | $6,235 | $42,870 |
| 2022 | $613 | $38,670 | $5,080 | $33,590 |
| 2021 | $582 | $35,575 | $5,080 | $30,495 |
| 2020 | $434 | $26,280 | $5,080 | $21,200 |
| 2019 | $416 | $24,115 | $4,620 | $19,495 |
| 2018 | $380 | $21,580 | $4,620 | $16,960 |
| 2017 | $378 | $21,355 | $4,620 | $16,735 |
| 2016 | $389 | $21,355 | $4,620 | $16,735 |
| 2015 | $446 | $22,705 | $3,850 | $18,855 |
| 2010 | -- | $22,705 | $3,850 | $18,855 |
Source: Public Records
Map
Nearby Homes