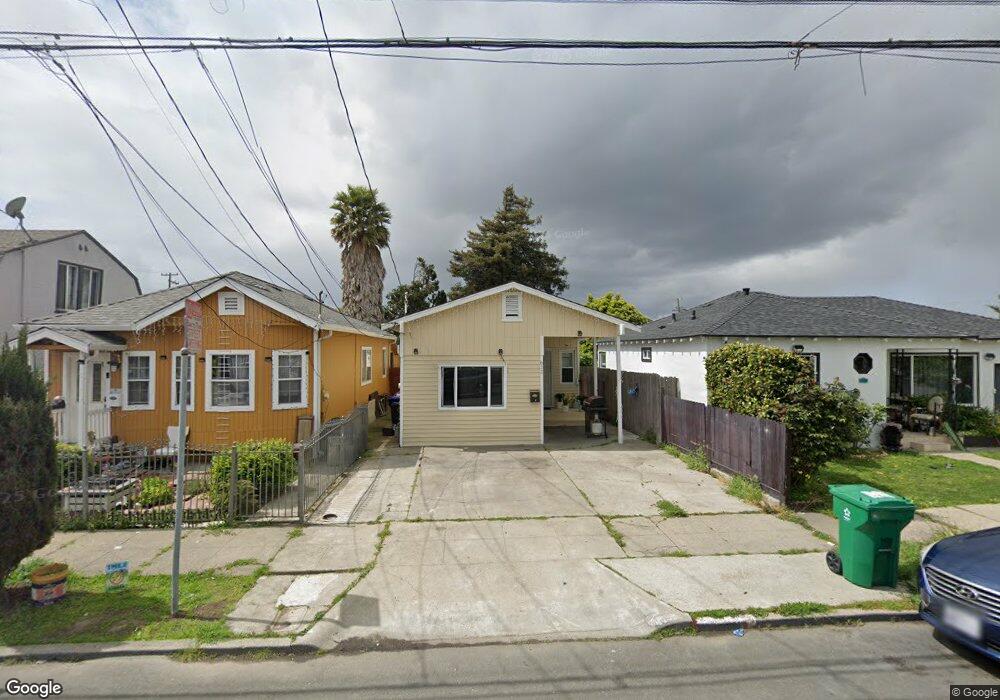
611 21st St Richmond, CA 94801
Belding Woods NeighborhoodEstimated Value: $495,000 - $644,000
3
Beds
2
Baths
1,265
Sq Ft
$433/Sq Ft
Est. Value
About This Home
This home is located at 611 21st St, Richmond, CA 94801 and is currently estimated at $548,250, approximately $433 per square foot. 611 21st St is a home located in Contra Costa County with nearby schools including Grant Elementary School, Lovonya DeJean Middle School, and John F. Kennedy High School.
Ownership History
Date
Name
Owned For
Owner Type
Purchase Details
Closed on
Sep 10, 2012
Sold by
Higdon Bobby J and Muller Larry
Bought by
Wong Yien Ming and Wong Sim Chen
Current Estimated Value
Purchase Details
Closed on
Aug 16, 2010
Sold by
Higdon Bobby J and Muller Beverly
Bought by
Hidgon Bobby J and Muller Larry
Purchase Details
Closed on
Sep 18, 2003
Sold by
Hiatt Henry B
Bought by
Hiatt Henry B and Hiatt Margaret A
Purchase Details
Closed on
Mar 22, 1995
Sold by
Hiatt Helen E
Bought by
Hiatt Helen E and Hiatt Henry B
Create a Home Valuation Report for This Property
The Home Valuation Report is an in-depth analysis detailing your home's value as well as a comparison with similar homes in the area
Home Values in the Area
Average Home Value in this Area
Purchase History
| Date | Buyer | Sale Price | Title Company |
|---|---|---|---|
| Wong Yien Ming | $95,000 | Chicago Title Company | |
| Hidgon Bobby J | -- | None Available | |
| Hiatt Henry B | -- | -- | |
| Hiatt Helen E | -- | -- |
Source: Public Records
Tax History
| Year | Tax Paid | Tax Assessment Tax Assessment Total Assessment is a certain percentage of the fair market value that is determined by local assessors to be the total taxable value of land and additions on the property. | Land | Improvement |
|---|---|---|---|---|
| 2025 | $3,173 | $116,972 | $49,250 | $67,722 |
| 2024 | $3,103 | $114,680 | $48,285 | $66,395 |
| 2023 | $3,103 | $112,433 | $47,339 | $65,094 |
| 2022 | $3,779 | $110,229 | $46,411 | $63,818 |
| 2021 | $3,336 | $108,068 | $45,501 | $62,567 |
| 2019 | $2,753 | $104,864 | $44,152 | $60,712 |
| 2018 | $2,648 | $102,809 | $43,287 | $59,522 |
| 2017 | $2,569 | $100,794 | $42,439 | $58,355 |
| 2016 | $2,502 | $98,818 | $41,607 | $57,211 |
| 2015 | $2,460 | $97,335 | $40,983 | $56,352 |
| 2014 | $2,445 | $95,430 | $40,181 | $55,249 |
Source: Public Records
Map
Nearby Homes
Your Personal Tour Guide
Ask me questions while you tour the home.