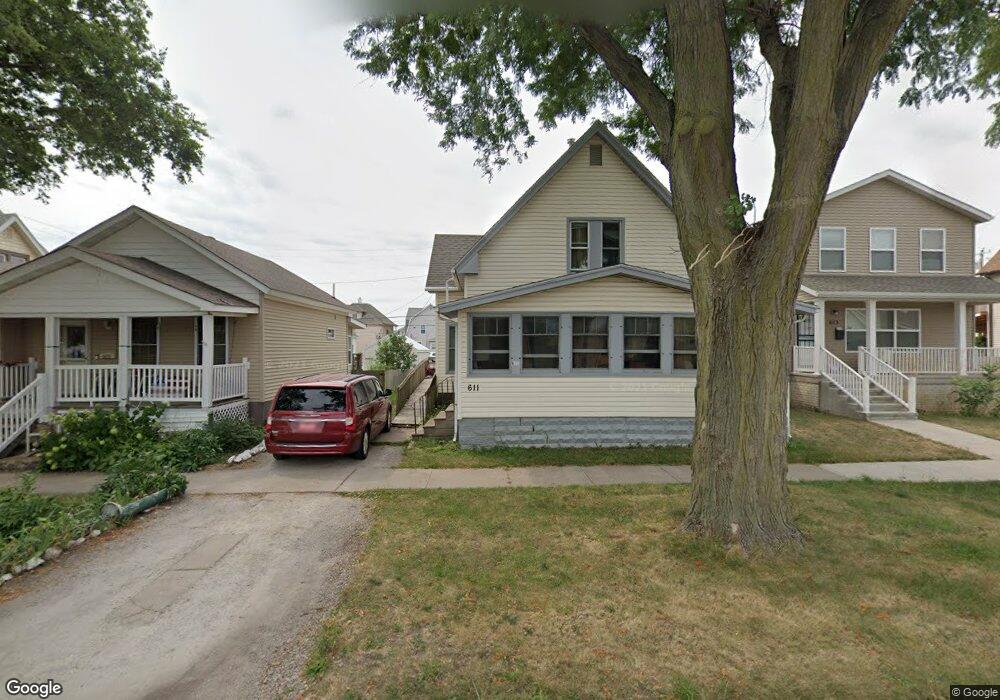
611 A Ave NW Cedar Rapids, IA 52405
Northwest Area NeighborhoodEstimated Value: $144,000 - $170,000
4
Beds
2
Baths
1,629
Sq Ft
$96/Sq Ft
Est. Value
About This Home
This home is located at 611 A Ave NW, Cedar Rapids, IA 52405 and is currently estimated at $155,602, approximately $95 per square foot. 611 A Ave NW is a home located in Linn County with nearby schools including Junction City Elementary School, Harrison Elementary School, and Kentucky Tech - Ashland Reg Tech Center.
Ownership History
Date
Name
Owned For
Owner Type
Purchase Details
Closed on
Sep 30, 2015
Sold by
The Estate Of Wayne A Griffioen
Bought by
Griffioen Patricia A
Current Estimated Value
Home Financials for this Owner
Home Financials are based on the most recent Mortgage that was taken out on this home.
Original Mortgage
$51,805
Interest Rate
3.91%
Mortgage Type
New Conventional
Create a Home Valuation Report for This Property
The Home Valuation Report is an in-depth analysis detailing your home's value as well as a comparison with similar homes in the area
Home Values in the Area
Average Home Value in this Area
Purchase History
| Date | Buyer | Sale Price | Title Company |
|---|---|---|---|
| Griffioen Patricia A | -- | None Available |
Source: Public Records
Mortgage History
| Date | Status | Borrower | Loan Amount |
|---|---|---|---|
| Previous Owner | Griffioen Patricia A | $51,805 |
Source: Public Records
Tax History Compared to Growth
Tax History
| Year | Tax Paid | Tax Assessment Tax Assessment Total Assessment is a certain percentage of the fair market value that is determined by local assessors to be the total taxable value of land and additions on the property. | Land | Improvement |
|---|---|---|---|---|
| 2025 | $2,174 | $144,800 | $24,000 | $120,800 |
| 2024 | $2,640 | $124,700 | $24,000 | $100,700 |
| 2023 | $2,640 | $122,900 | $24,000 | $98,900 |
| 2022 | $2,376 | $125,200 | $22,000 | $103,200 |
| 2021 | $2,284 | $114,700 | $22,000 | $92,700 |
| 2020 | $2,284 | $103,500 | $18,000 | $85,500 |
| 2019 | $1,466 | $68,000 | $12,000 | $56,000 |
| 2018 | $674 | $68,000 | $12,000 | $56,000 |
| 2017 | $1,390 | $65,400 | $12,000 | $53,400 |
| 2016 | $1,390 | $65,400 | $12,000 | $53,400 |
| 2015 | $1,388 | $65,222 | $12,000 | $53,222 |
| 2014 | $1,388 | $65,222 | $12,000 | $53,222 |
| 2013 | $1,358 | $65,222 | $12,000 | $53,222 |
Source: Public Records
Map
Nearby Homes