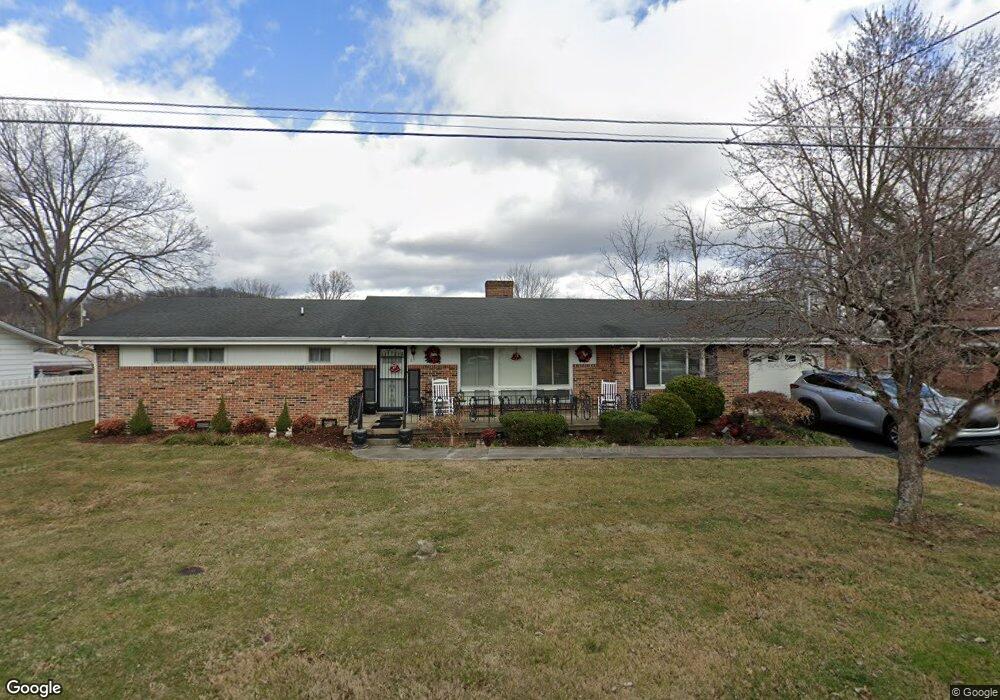
611 Barker St Elizabethton, TN 37643
Estimated Value: $172,000 - $302,000
--
Bed
2
Baths
1,812
Sq Ft
$129/Sq Ft
Est. Value
About This Home
This home is located at 611 Barker St, Elizabethton, TN 37643 and is currently estimated at $233,903, approximately $129 per square foot. 611 Barker St is a home located in Carter County with nearby schools including Elizabethton High School and East Tn Christian Home & Academy.
Ownership History
Date
Name
Owned For
Owner Type
Purchase Details
Closed on
Sep 17, 2010
Sold by
Street Sandra L
Bought by
Alderson Sue
Current Estimated Value
Purchase Details
Closed on
Aug 24, 2001
Sold by
Bowers Darnell
Bought by
Bobbitt Teresa
Home Financials for this Owner
Home Financials are based on the most recent Mortgage that was taken out on this home.
Original Mortgage
$61,100
Interest Rate
7.02%
Purchase Details
Closed on
Mar 30, 2001
Sold by
Alexander Edwin
Bought by
Bowers Darrell
Purchase Details
Closed on
Dec 29, 1994
Sold by
Estep Richard
Bought by
Mckinney Steve
Purchase Details
Closed on
Sep 28, 1983
Bought by
Peters Virna C L and Peters Francis E
Create a Home Valuation Report for This Property
The Home Valuation Report is an in-depth analysis detailing your home's value as well as a comparison with similar homes in the area
Home Values in the Area
Average Home Value in this Area
Purchase History
| Date | Buyer | Sale Price | Title Company |
|---|---|---|---|
| Alderson Sue | $80,000 | -- | |
| Bobbitt Teresa | $67,900 | -- | |
| Bowers Darrell | $39,500 | -- | |
| Mckinney Steve | $7,000 | -- | |
| Peters Virna C L | -- | -- |
Source: Public Records
Mortgage History
| Date | Status | Borrower | Loan Amount |
|---|---|---|---|
| Previous Owner | Peters Virna C L | $61,100 |
Source: Public Records
Tax History Compared to Growth
Tax History
| Year | Tax Paid | Tax Assessment Tax Assessment Total Assessment is a certain percentage of the fair market value that is determined by local assessors to be the total taxable value of land and additions on the property. | Land | Improvement |
|---|---|---|---|---|
| 2024 | $1,568 | $47,525 | $9,425 | $38,100 |
| 2023 | $1,568 | $47,525 | $0 | $0 |
| 2022 | $1,711 | $47,525 | $9,425 | $38,100 |
| 2021 | $965 | $47,525 | $9,425 | $38,100 |
| 2020 | $1,476 | $47,525 | $9,425 | $38,100 |
| 2019 | $1,476 | $34,175 | $4,400 | $29,775 |
| 2018 | $1,456 | $34,175 | $4,400 | $29,775 |
| 2017 | $1,456 | $34,175 | $4,400 | $29,775 |
| 2016 | $1,449 | $34,175 | $4,400 | $29,775 |
| 2015 | $1,452 | $34,175 | $4,400 | $29,775 |
| 2014 | $1,423 | $33,325 | $4,400 | $28,925 |
Source: Public Records
Map
Nearby Homes