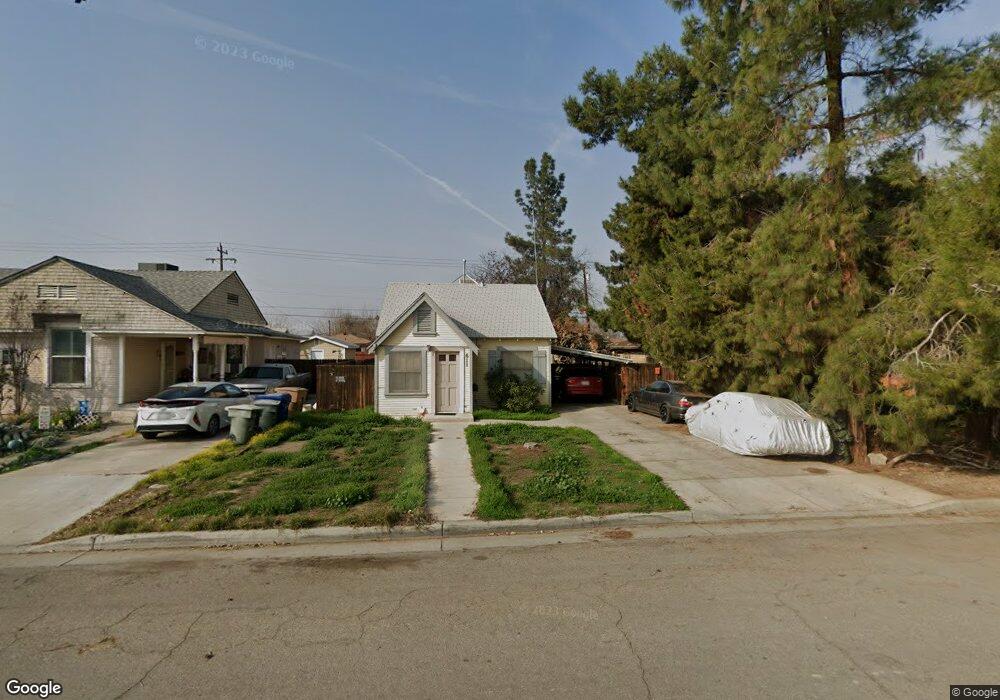
611 Beech St Bakersfield, CA 93304
Oleander-Sunset NeighborhoodEstimated Value: $216,000 - $252,000
3
Beds
1
Bath
1,042
Sq Ft
$230/Sq Ft
Est. Value
About This Home
This home is located at 611 Beech St, Bakersfield, CA 93304 and is currently estimated at $239,195, approximately $229 per square foot. 611 Beech St is a home located in Kern County with nearby schools including William Penn Elementary School, Emerson Middle School, and Bakersfield High School.
Ownership History
Date
Name
Owned For
Owner Type
Purchase Details
Closed on
Nov 22, 2021
Sold by
Mickelsen Eric and Delfino-Mickelsen Natalie
Bought by
Mckenna Matthew and Forder Margaret
Current Estimated Value
Home Financials for this Owner
Home Financials are based on the most recent Mortgage that was taken out on this home.
Original Mortgage
$142,500
Outstanding Balance
$130,793
Interest Rate
3.11%
Mortgage Type
New Conventional
Estimated Equity
$108,402
Purchase Details
Closed on
Aug 10, 2010
Sold by
Deutsche Bank National Trust Company
Bought by
Mickelson Eric and Delfino Mickelson Natalie
Purchase Details
Closed on
Mar 19, 2010
Sold by
Sevillanos Jose F
Bought by
Deutsche Bank National Trust Company
Purchase Details
Closed on
Jul 24, 2005
Sold by
Lyman John C
Bought by
Sevillanos Jose F
Home Financials for this Owner
Home Financials are based on the most recent Mortgage that was taken out on this home.
Original Mortgage
$176,000
Interest Rate
7.99%
Mortgage Type
Fannie Mae Freddie Mac
Create a Home Valuation Report for This Property
The Home Valuation Report is an in-depth analysis detailing your home's value as well as a comparison with similar homes in the area
Home Values in the Area
Average Home Value in this Area
Purchase History
| Date | Buyer | Sale Price | Title Company |
|---|---|---|---|
| Mckenna Matthew | $190,000 | New Title Company Name | |
| Mickelson Eric | $59,500 | Ticor Title Company | |
| Deutsche Bank National Trust Company | $55,114 | Accommodation | |
| Sevillanos Jose F | $220,000 | Commonwealth Title |
Source: Public Records
Mortgage History
| Date | Status | Borrower | Loan Amount |
|---|---|---|---|
| Open | Mckenna Matthew | $142,500 | |
| Previous Owner | Sevillanos Jose F | $176,000 |
Source: Public Records
Tax History
| Year | Tax Paid | Tax Assessment Tax Assessment Total Assessment is a certain percentage of the fair market value that is determined by local assessors to be the total taxable value of land and additions on the property. | Land | Improvement |
|---|---|---|---|---|
| 2025 | $3,563 | $201,629 | $42,448 | $159,181 |
| 2024 | $3,563 | $197,676 | $41,616 | $156,060 |
| 2023 | $3,480 | $193,800 | $40,800 | $153,000 |
| 2022 | $1,988 | $72,427 | $24,141 | $48,286 |
| 2021 | $1,807 | $71,008 | $23,668 | $47,340 |
| 2020 | $1,807 | $70,281 | $23,426 | $46,855 |
| 2019 | $1,708 | $70,281 | $23,426 | $46,855 |
| 2018 | $1,675 | $67,554 | $22,517 | $45,037 |
| 2017 | $1,660 | $66,230 | $22,076 | $44,154 |
| 2016 | $1,571 | $64,933 | $21,644 | $43,289 |
| 2015 | $1,552 | $63,958 | $21,319 | $42,639 |
| 2014 | $1,504 | $62,706 | $20,902 | $41,804 |
Source: Public Records
Map
Nearby Homes
- 622 Cypress St
- 615 Cypress St
- 2731 Dracena St
- 416 Beech St
- 412 Beech St
- 2825 San Emidio St
- 2709 Sunset Ave
- 2730 Buena Vista St
- 2714 Sunset Ave
- 3007 Park Way
- 315 Cypress St
- 2416 Chester Ln
- 625 A St
- 2901 California Ave
- 2501 4th St
- 344 Oakdale Dr
- 2709 California Ave
- 2325 Chester Ln
- 501 B St
- 210 Cypress St
Your Personal Tour Guide
Ask me questions while you tour the home.