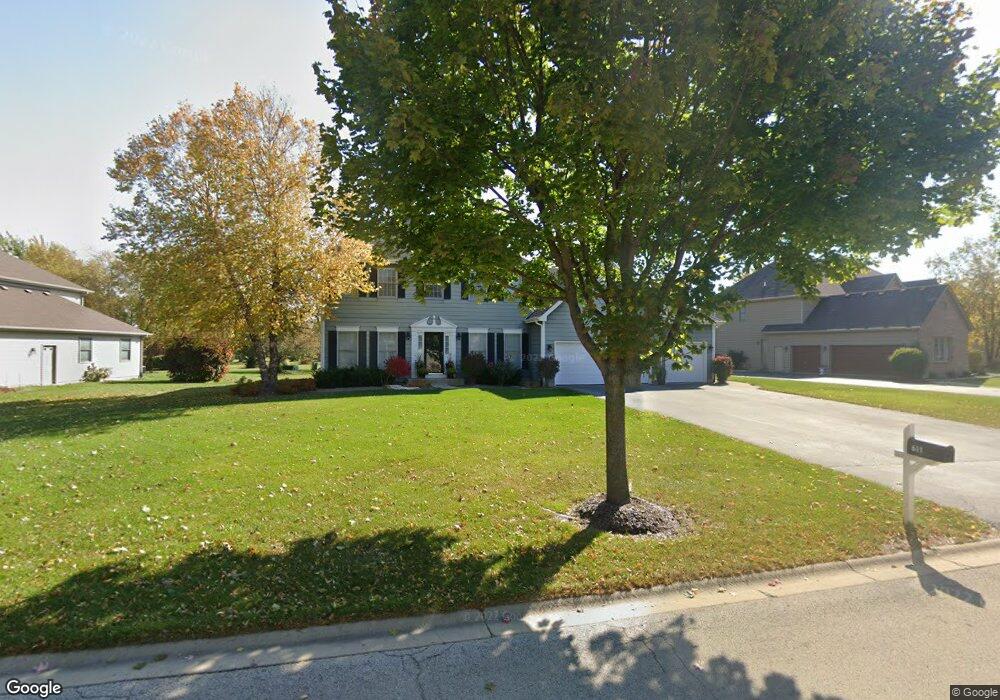
611 Clover Dr Algonquin, IL 60102
Far West Algonquin NeighborhoodEstimated Value: $559,682 - $659,000
Studio
--
Bath
2,695
Sq Ft
$226/Sq Ft
Est. Value
About This Home
This home is located at 611 Clover Dr, Algonquin, IL 60102 and is currently estimated at $609,671, approximately $226 per square foot. 611 Clover Dr is a home located in McHenry County with nearby schools including Mackeben Elementary School, Conley Elementary School, and Heineman Middle School.
Ownership History
Date
Name
Owned For
Owner Type
Purchase Details
Closed on
Sep 16, 2010
Sold by
Colditz Joseph S and Colditz Susan L
Bought by
Colditz Joseph S and Colditz Susan L
Current Estimated Value
Home Financials for this Owner
Home Financials are based on the most recent Mortgage that was taken out on this home.
Original Mortgage
$262,400
Interest Rate
4.42%
Mortgage Type
New Conventional
Purchase Details
Closed on
Oct 11, 2004
Sold by
Home State Bank National Assn
Bought by
Colditz Joseph S and Wier Susan L
Home Financials for this Owner
Home Financials are based on the most recent Mortgage that was taken out on this home.
Original Mortgage
$309,800
Interest Rate
5.86%
Mortgage Type
Purchase Money Mortgage
Purchase Details
Closed on
Mar 1, 2004
Sold by
Algonquin State Bank
Bought by
Home State Bank Na
Create a Home Valuation Report for This Property
The Home Valuation Report is an in-depth analysis detailing your home's value as well as a comparison with similar homes in the area
Home Values in the Area
Average Home Value in this Area
Purchase History
| Date | Buyer | Sale Price | Title Company |
|---|---|---|---|
| Colditz Joseph S | -- | Nat | |
| Colditz Joseph S | $387,154 | Ticor Title | |
| Home State Bank Na | -- | -- |
Source: Public Records
Mortgage History
| Date | Status | Borrower | Loan Amount |
|---|---|---|---|
| Closed | Colditz Joseph S | $262,400 | |
| Previous Owner | Colditz Joseph S | $309,800 |
Source: Public Records
Tax History
| Year | Tax Paid | Tax Assessment Tax Assessment Total Assessment is a certain percentage of the fair market value that is determined by local assessors to be the total taxable value of land and additions on the property. | Land | Improvement |
|---|---|---|---|---|
| 2024 | $11,675 | $166,689 | $17,702 | $148,987 |
| 2023 | $11,347 | $149,739 | $15,902 | $133,837 |
| 2022 | $10,779 | $136,349 | $14,480 | $121,869 |
| 2021 | $10,422 | $128,413 | $13,637 | $114,776 |
| 2020 | $10,269 | $124,988 | $13,273 | $111,715 |
| 2019 | $10,478 | $127,305 | $12,934 | $114,371 |
| 2018 | $9,832 | $117,176 | $14,556 | $102,620 |
| 2017 | $9,724 | $110,429 | $13,718 | $96,711 |
| 2016 | $9,814 | $104,990 | $13,042 | $91,948 |
| 2013 | -- | $106,464 | $19,786 | $86,678 |
Source: Public Records
Map
Nearby Homes
- 3650 Wintergreen Terrace
- 940 Treeline Dr
- 212 Rhinebeck Way
- 4241 Wanderlust Dr
- 430 Tuscany Dr
- 531 Alpine Dr
- 1171 Kingsmill Dr
- 9105 Algonquin Rd
- 16 Springbrook Ln
- 3260 Nottingham Dr
- 2660 Harnish Dr
- 320 Boulder Dr
- 11320 Wildridge Ln
- 11290 Wildridge Ln
- 6 Sugar Maple Ct
- 11371 Wildridge Ln
- 9937 Edgebrook Ln
- 9946 Edgebrook Ln
- 601 Woods Creek Ln
- 9947 Edgebrook Ln
Your Personal Tour Guide
Ask me questions while you tour the home.