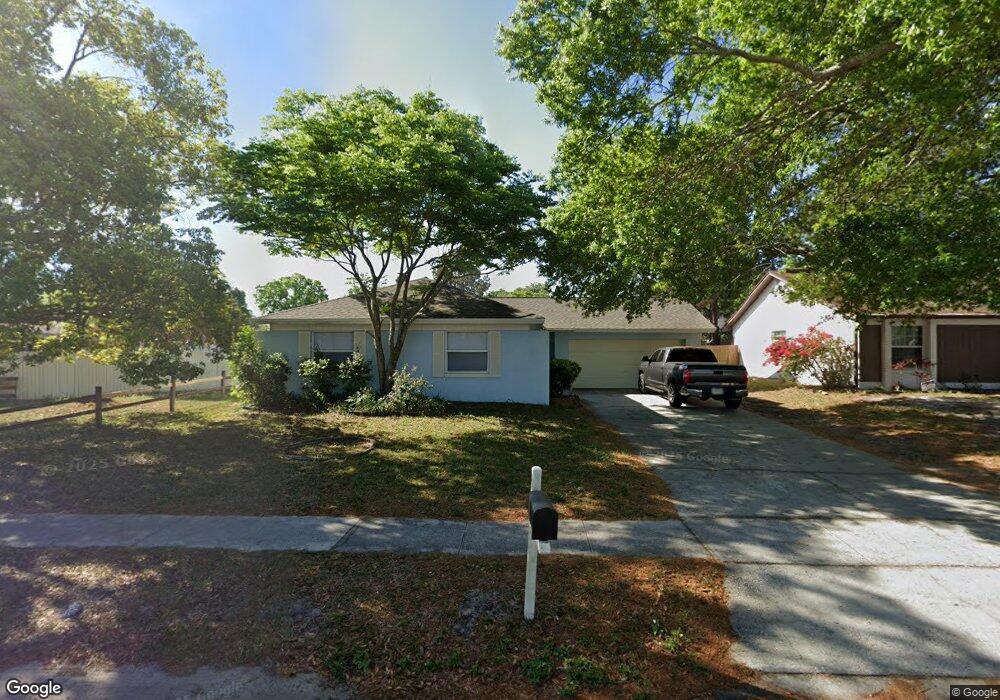
611 Colgate Dr Altamonte Springs, FL 32714
Spring Valley NeighborhoodEstimated Value: $298,000 - $333,000
3
Beds
2
Baths
1,258
Sq Ft
$252/Sq Ft
Est. Value
About This Home
This home is located at 611 Colgate Dr, Altamonte Springs, FL 32714 and is currently estimated at $317,141, approximately $252 per square foot. 611 Colgate Dr is a home located in Seminole County with nearby schools including Spring Lake Elementary School, Teague Middle School, and Lake Brantley High School.
Ownership History
Date
Name
Owned For
Owner Type
Purchase Details
Closed on
Jan 21, 2003
Sold by
Abdelmessih Faris and Abdelmessih Pamela E
Bought by
Navarro Rick and Navarro Yumi
Current Estimated Value
Home Financials for this Owner
Home Financials are based on the most recent Mortgage that was taken out on this home.
Original Mortgage
$96,300
Outstanding Balance
$40,963
Interest Rate
5.98%
Estimated Equity
$276,178
Purchase Details
Closed on
Aug 7, 1998
Sold by
Gerald D Fritz Tr
Bought by
Abdelmessih Faris and Abdelmessih Pamela
Home Financials for this Owner
Home Financials are based on the most recent Mortgage that was taken out on this home.
Original Mortgage
$75,409
Interest Rate
6.96%
Mortgage Type
FHA
Purchase Details
Closed on
Dec 1, 1986
Bought by
Navarro Rick and Navarro Yumi
Purchase Details
Closed on
Aug 1, 1981
Bought by
Navarro Rick and Navarro Yumi
Purchase Details
Closed on
Feb 1, 1979
Bought by
Navarro Rick and Navarro Yumi
Create a Home Valuation Report for This Property
The Home Valuation Report is an in-depth analysis detailing your home's value as well as a comparison with similar homes in the area
Home Values in the Area
Average Home Value in this Area
Purchase History
| Date | Buyer | Sale Price | Title Company |
|---|---|---|---|
| Navarro Rick | $120,500 | Equitable Title Agency Inc | |
| Abdelmessih Faris | $75,500 | -- | |
| Navarro Rick | $100 | -- | |
| Navarro Rick | $58,900 | -- | |
| Navarro Rick | $36,100 | -- |
Source: Public Records
Mortgage History
| Date | Status | Borrower | Loan Amount |
|---|---|---|---|
| Open | Navarro Rick | $96,300 | |
| Previous Owner | Abdelmessih Faris | $75,500 | |
| Previous Owner | Abdelmessih Faris | $75,409 |
Source: Public Records
Tax History Compared to Growth
Tax History
| Year | Tax Paid | Tax Assessment Tax Assessment Total Assessment is a certain percentage of the fair market value that is determined by local assessors to be the total taxable value of land and additions on the property. | Land | Improvement |
|---|---|---|---|---|
| 2024 | $3,531 | $215,357 | -- | -- |
| 2023 | $3,277 | $195,779 | $0 | $0 |
| 2021 | $2,773 | $161,801 | $0 | $0 |
| 2020 | $2,500 | $178,892 | $0 | $0 |
| 2019 | $2,412 | $175,834 | $0 | $0 |
| 2018 | $2,268 | $164,634 | $0 | $0 |
| 2017 | $2,140 | $110,513 | $0 | $0 |
| 2016 | $1,920 | $123,442 | $0 | $0 |
| 2015 | $1,339 | $96,473 | $0 | $0 |
| 2014 | $1,339 | $89,360 | $0 | $0 |
Source: Public Records
Map
Nearby Homes
- 610 Dunn Dr
- 647 Clemson Dr
- 631 Clemson Dr
- 174 Waterfall Way Unit 106
- 114 Variety Tree Cir
- 180 Waterfall Way Unit 203
- 478 Clemson Dr
- 196 Riverbend Dr Unit 101
- 232 Riverbend Dr Unit 201
- 829 Camargo Way Unit 211
- 238 Riverbend Dr Unit 103
- 238 Riverbend Dr Unit 107
- 827 Camargo Way Unit 307
- 609 Balsa Dr
- 0 None St Unit MFRO6352464
- 826 Camargo Way Unit 307
- 823 Camargo Way Unit 101
- 511 Bristol Dr
- 824 Camargo Way Unit 106
- 148 Olive Tree Cir