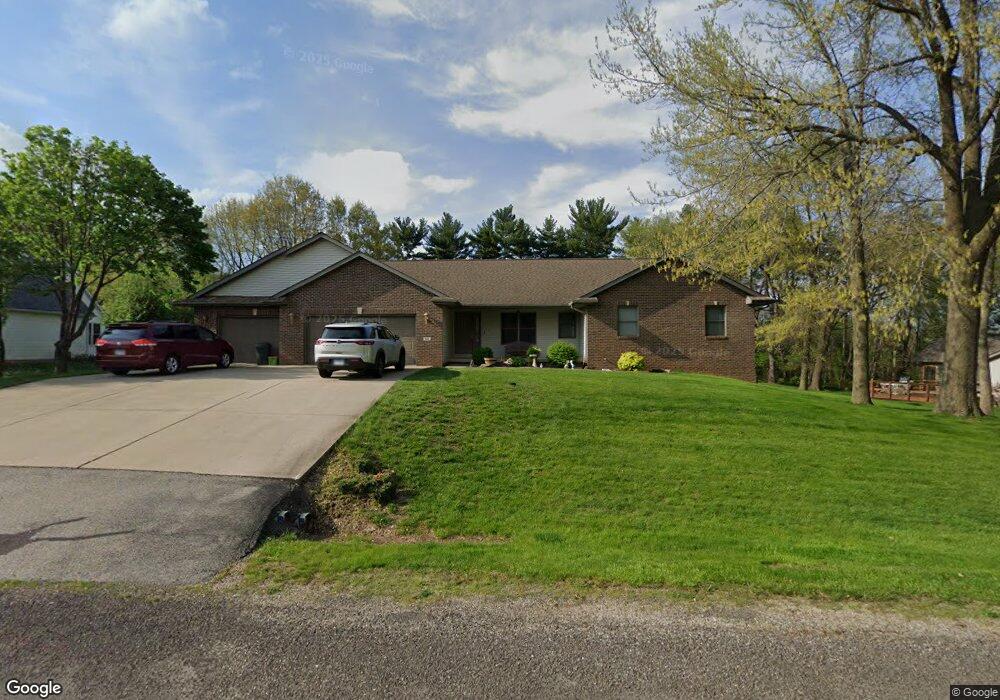
611 Crabapple Ln Sherman, IL 62684
Estimated Value: $411,000 - $492,000
6
Beds
5
Baths
4,607
Sq Ft
$99/Sq Ft
Est. Value
About This Home
This home is located at 611 Crabapple Ln, Sherman, IL 62684 and is currently estimated at $455,503, approximately $98 per square foot. 611 Crabapple Ln is a home located in Sangamon County with nearby schools including Tri-City Elementary School, Tri-City Junior High School, and Tri-City High School.
Ownership History
Date
Name
Owned For
Owner Type
Purchase Details
Closed on
Sep 21, 1998
Current Estimated Value
Create a Home Valuation Report for This Property
The Home Valuation Report is an in-depth analysis detailing your home's value as well as a comparison with similar homes in the area
Home Values in the Area
Average Home Value in this Area
Purchase History
| Date | Buyer | Sale Price | Title Company |
|---|---|---|---|
| -- | $19,500 | -- |
Source: Public Records
Tax History Compared to Growth
Tax History
| Year | Tax Paid | Tax Assessment Tax Assessment Total Assessment is a certain percentage of the fair market value that is determined by local assessors to be the total taxable value of land and additions on the property. | Land | Improvement |
|---|---|---|---|---|
| 2024 | $6,751 | $112,893 | $14,882 | $98,011 |
| 2023 | $6,393 | $104,425 | $13,766 | $90,659 |
| 2022 | $6,060 | $97,194 | $12,813 | $84,381 |
| 2021 | $5,942 | $93,134 | $12,278 | $80,856 |
| 2020 | $6,205 | $92,533 | $12,199 | $80,334 |
| 2019 | $6,005 | $92,118 | $12,144 | $79,974 |
| 2018 | $5,877 | $90,410 | $11,919 | $78,491 |
| 2017 | $5,775 | $87,922 | $11,591 | $76,331 |
| 2016 | $5,614 | $85,221 | $11,235 | $73,986 |
| 2015 | $5,531 | $82,860 | $10,924 | $71,936 |
| 2014 | $5,445 | $81,563 | $10,753 | $70,810 |
| 2013 | $5,346 | $83,503 | $10,854 | $72,649 |
Source: Public Records
Map
Nearby Homes
- 2675 Overpass Rd
- 14 Spring St
- 22 Mary Ln Unit 1
- 1125 N 3rd St Unit 1
- 5324 River View Rd Unit 1
- 1000 E Washington St Unit 1
- 984 E Washington St Unit 1
- 500 E Jefferson St
- 0 E Lincoln St
- 205 S 8th St Unit 1
- 232 S 8th St Unit 1
- 9320 Dawson Ln
- 5915 County Rd 1a N
- 40 Woods Mill Rd
- 2428 Normal Dr
- 3909 Mccormick Dr
- 108 Delta Dawn Unit BV108
- 2405 Grom Dr
- 56 Castings Rd Unit BV56
- 255 Possum Pass Ct
- 0 Barclay Rd
- 601 Crabapple Ln
- 621 Crabapple Ln
- 340 High Meadow
- 610 Crabapple Ln
- 620 Crabapple Ln
- 330 High Meadow
- 630 Crabapple Ln
- 385 High Meadow Ln
- 385 High Meadow
- 365 High Meadow
- 611 Briarwood Rd
- 6623 Barclay Rd Unit 1
- 631 Briarwood Rd
- 631 Briarwood Rd
- 320 High Meadow
- 6477 Barclay Road 32 79 Acres
- 6477 Barclay Rd
- 6477 Barclay Road 99 84 Acres
- 335 High Meadow