Estimated Value: $210,000 - $274,000
3
Beds
3
Baths
1,860
Sq Ft
$129/Sq Ft
Est. Value
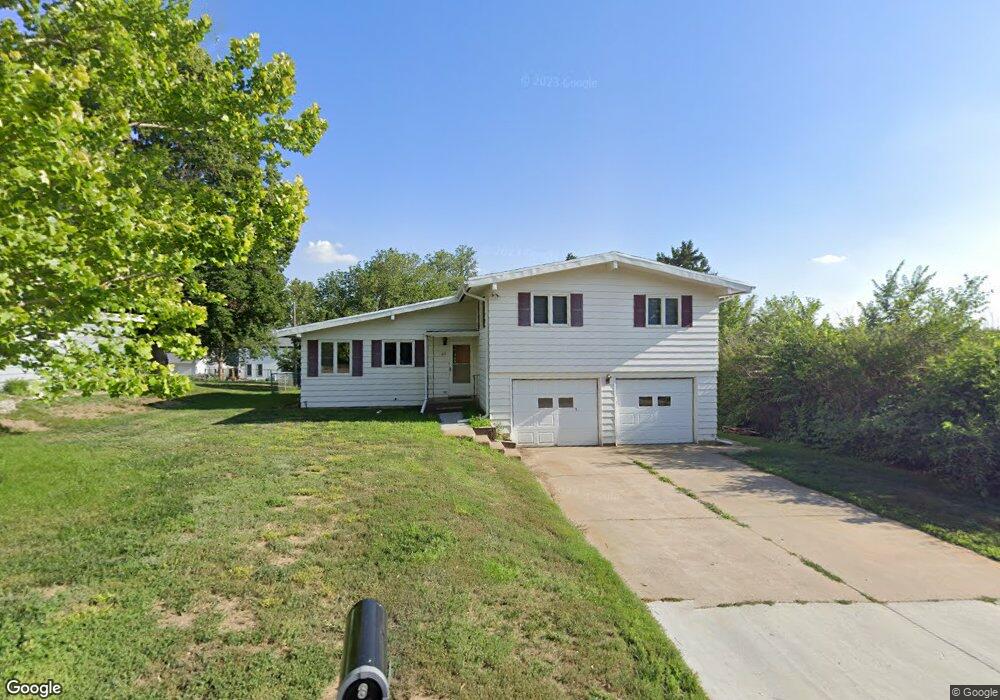
About This Home
This home is located at 611 E 10th St, Wayne, NE 68787 and is currently estimated at $240,561, approximately $129 per square foot. 611 E 10th St is a home located in Wayne County with nearby schools including Wayne Elementary School, Wayne High School, and St. Mary Elementary School.
Ownership History
Date
Name
Owned For
Owner Type
Purchase Details
Closed on
Mar 17, 2022
Sold by
Mw Real Estate Investment Group Llc
Bought by
Pfeifer Neil J and Pfeffer Becky L
Current Estimated Value
Home Financials for this Owner
Home Financials are based on the most recent Mortgage that was taken out on this home.
Original Mortgage
$153,806
Outstanding Balance
$134,791
Interest Rate
3.92%
Mortgage Type
Credit Line Revolving
Estimated Equity
$105,770
Purchase Details
Closed on
Jan 19, 2022
Sold by
Myers Construction Inc
Bought by
Mw Real Estate Investment Group Llc
Home Financials for this Owner
Home Financials are based on the most recent Mortgage that was taken out on this home.
Original Mortgage
$153,806
Outstanding Balance
$134,791
Interest Rate
3.92%
Mortgage Type
Credit Line Revolving
Estimated Equity
$105,770
Purchase Details
Closed on
Jul 9, 2021
Sold by
Fuelberth Darrel D and Fuelberth Nancy L
Bought by
Myers Construction Inc
Create a Home Valuation Report for This Property
The Home Valuation Report is an in-depth analysis detailing your home's value as well as a comparison with similar homes in the area
Home Values in the Area
Average Home Value in this Area
Purchase History
| Date | Buyer | Sale Price | Title Company |
|---|---|---|---|
| Pfeifer Neil J | $205,000 | None Listed On Document | |
| Mw Real Estate Investment Group Llc | $140,000 | New Title Company Name | |
| Mw Real Estate Investment Group Llc | $140,000 | New Title Company Name | |
| Myers Construction Inc | $140,000 | None Available |
Source: Public Records
Mortgage History
| Date | Status | Borrower | Loan Amount |
|---|---|---|---|
| Open | Pfeifer Neil J | $153,806 | |
| Closed | Mw Real Estate Investment Group Llc | $0 |
Source: Public Records
Tax History
| Year | Tax Paid | Tax Assessment Tax Assessment Total Assessment is a certain percentage of the fair market value that is determined by local assessors to be the total taxable value of land and additions on the property. | Land | Improvement |
|---|---|---|---|---|
| 2025 | $2,261 | $200,055 | $18,205 | $181,850 |
| 2024 | $2,261 | $178,560 | $12,130 | $166,430 |
| 2023 | $2,739 | $161,040 | $12,130 | $148,910 |
| 2022 | $2,351 | $134,765 | $12,130 | $122,635 |
| 2021 | $2,148 | $117,825 | $12,130 | $105,695 |
| 2020 | $2,108 | $117,825 | $12,130 | $105,695 |
| 2019 | $2,079 | $117,825 | $12,130 | $105,695 |
| 2018 | $2,112 | $117,825 | $12,130 | $105,695 |
| 2017 | $1,728 | $97,470 | $10,080 | $87,390 |
| 2016 | $1,827 | $0 | $0 | $0 |
| 2015 | $1,785 | $97,470 | $10,080 | $87,390 |
| 2014 | -- | $97,470 | $10,080 | $87,390 |
| 2013 | -- | $97,470 | $10,080 | $87,390 |
Source: Public Records
Map
Nearby Homes
- 919 Pine Heights Rd
- 617 E 10th St
- 913 Pine Heights Rd
- 623 E 10th St
- 1000 Hillcrest Rd
- 1001 Lilac Ln
- 1005 Lilac Ln
- 907 Pine Heights Rd
- 703 E 10th St
- 918 Pine Heights Rd
- 700 Sunnyview Dr
- 914 Pine Heights Rd
- 1009 Lilac Ln
- 1010 Hillcrest Rd
- 704 E 10th St
- 709 E 10th St
- 910 Pine Heights Rd
- 710 Sunnyview Dr
- 1014 Hillcrest Rd
- 1000 Lilac Ln
Your Personal Tour Guide
Ask me questions while you tour the home.