611 E 21st Ave Cordele, GA 31015
Estimated Value: $170,000 - $216,000
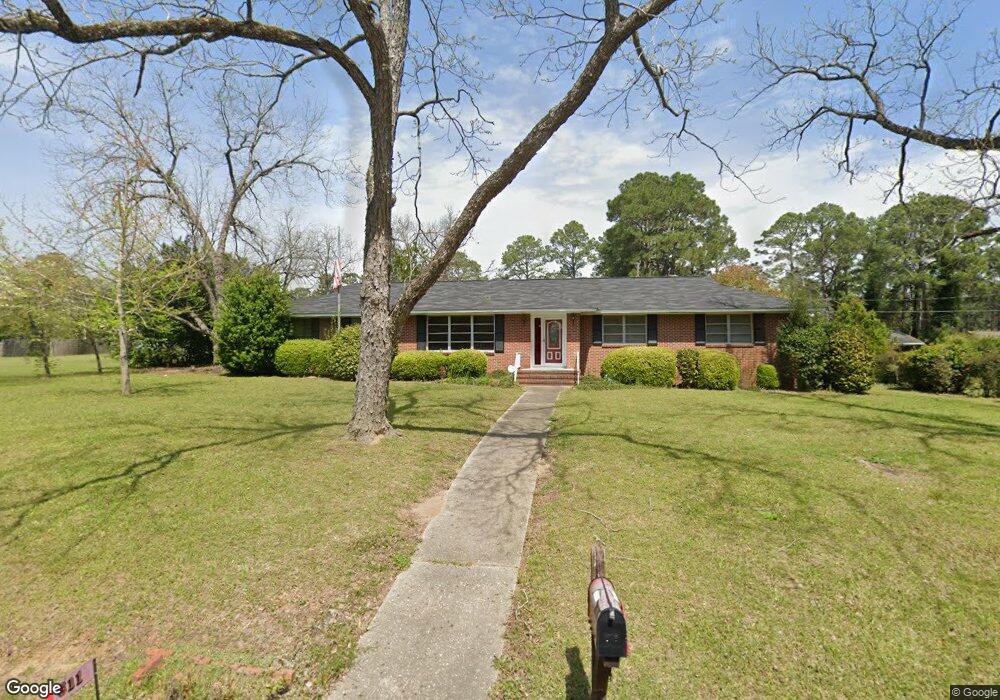
About This Home
This home is located at 611 E 21st Ave, Cordele, GA 31015 and is currently estimated at $192,196, approximately $116 per square foot. 611 E 21st Ave is a home located in Crisp County with nearby schools including Crisp County Elementary School, Crisp County Primary School, and Crisp County Middle School.
Ownership History
We collect this data history from publicly available records. To have your information removed, we recommend requesting removal directly through your county’s website.
Purchase Details
Home Financials for this Owner
Home Financials are based on the most recent Mortgage that was taken out on this home.Purchase Details
Home Financials for this Owner
Home Financials are based on the most recent Mortgage that was taken out on this home.Purchase Details
Purchase Details
Purchase Details
Purchase History
We collect this data history from publicly available records. To have your information removed, we recommend requesting removal directly through your county’s website.
| Date | Buyer | Sale Price | Title Company |
|---|---|---|---|
| $129,800 | -- | ||
| $105,000 | -- | ||
| $90,000 | -- | ||
| -- | -- | ||
| -- | -- |
Mortgage History
We collect this data history from publicly available records. To have your information removed, we recommend requesting removal directly through your county’s website.
| Date | Status | Borrower | Loan Amount |
|---|---|---|---|
| Open | $127,448 | ||
| Previous Owner | $107,257 |
Tax History
We collect this data history from publicly available records. To have your information removed, we recommend requesting removal directly through your county’s website.
| Year | Tax Paid | Tax Assessment Tax Assessment Total Assessment is a certain percentage of the fair market value that is determined by local assessors to be the total taxable value of land and additions on the property. | Land | Improvement |
|---|---|---|---|---|
| 2025 | $2,311 | $68,656 | $5,120 | $63,536 |
| 2024 | $2,195 | $62,644 | $5,120 | $57,524 |
| 2023 | $2,087 | $57,078 | $2,560 | $54,518 |
| 2022 | $1,376 | $54,072 | $2,560 | $51,512 |
| 2021 | $1,349 | $51,066 | $2,560 | $48,506 |
| 2020 | $1,056 | $39,521 | $2,560 | $36,961 |
| 2019 | $1,064 | $39,521 | $2,560 | $36,961 |
| 2018 | $1,113 | $39,760 | $4,864 | $34,896 |
| 2017 | $1,615 | $39,760 | $4,864 | $34,896 |
| 2016 | $1,117 | $39,760 | $4,864 | $34,896 |
| 2015 | -- | $39,760 | $4,864 | $34,896 |
| 2014 | -- | $39,760 | $4,864 | $34,896 |
| 2013 | -- | $39,759 | $4,864 | $34,895 |
Map
- 720 E 20th Ave
- 718 E 22nd Ave
- 1002 Camellia Dr
- 716 E 18th Ave
- 1105 Camellia Dr
- 723 E 24th Ave
- 316 E 23rd Ave
- 511 E 25th Ave
- E 8th Ave
- 912 Rose Ln
- 1206 Fleming Rd
- 601 E 26th Ave
- 610 E 15th Ave
- 708 E 26th Ave Unit 4&5
- 708 E 26th Ave
- 1010 E 22nd Ave
- 1207 Fleming Rd
- 709 Fleming Rd
- 708 E 27th Ave
- 312 E 14th Ave
Ask me questions while you tour the home.