Estimated Value: $91,000 - $136,000
2
Beds
1
Bath
759
Sq Ft
$144/Sq Ft
Est. Value
About This Home
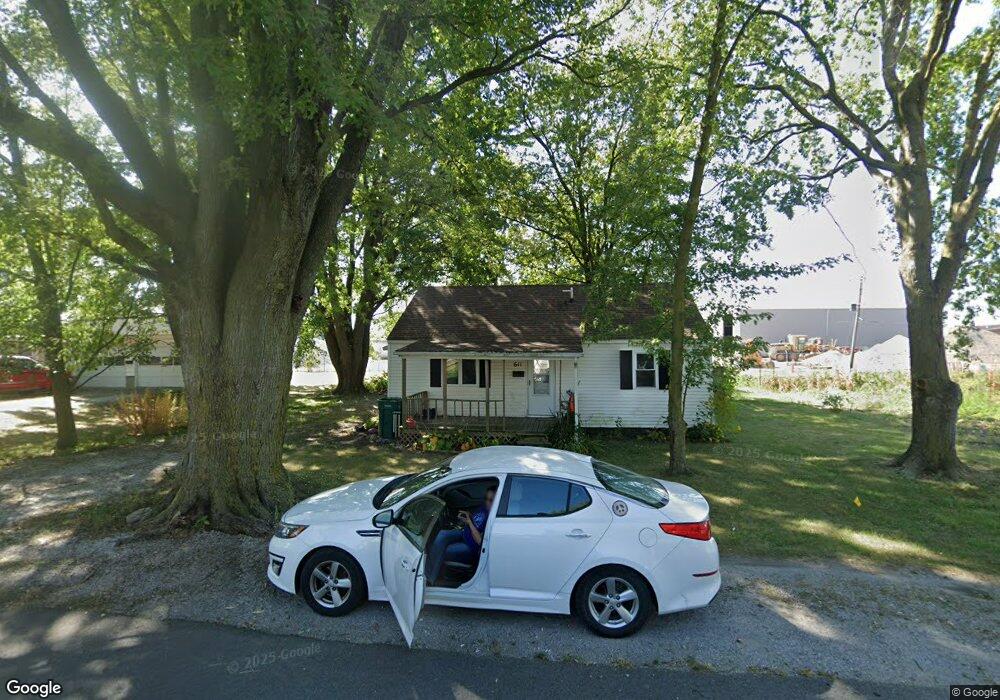
This home is located at 611 E Adams St, Flora, IN 46929 and is currently estimated at $109,634, approximately $144 per square foot. 611 E Adams St is a home located in Carroll County with nearby schools including Carroll Elementary School and Carroll Senior High School.
Ownership History
Date
Name
Owned For
Owner Type
Purchase Details
Closed on
Jun 13, 2011
Sold by
Eikenberry Dallas and Eikeberry Darlene
Bought by
Hoffman Gregory C and Hoffman Sherry L
Current Estimated Value
Home Financials for this Owner
Home Financials are based on the most recent Mortgage that was taken out on this home.
Original Mortgage
$22,400
Outstanding Balance
$15,248
Interest Rate
4.67%
Mortgage Type
New Conventional
Estimated Equity
$94,386
Purchase Details
Closed on
Sep 24, 2003
Sold by
Pledged Prperty Ii Llc
Bought by
Eikenberry Dallas and Eikenberry Darlene
Purchase Details
Closed on
May 21, 1997
Sold by
Matson Leroy and Matson Lois
Bought by
Short Gary and Short Donna
Create a Home Valuation Report for This Property
The Home Valuation Report is an in-depth analysis detailing your home's value as well as a comparison with similar homes in the area
Purchase History
| Date | Buyer | Sale Price | Title Company |
|---|---|---|---|
| Hoffman Gregory C | -- | None Available | |
| Eikenberry Dallas | $31,000 | -- | |
| Short Gary | $41,200 | -- |
Source: Public Records
Mortgage History
| Date | Status | Borrower | Loan Amount |
|---|---|---|---|
| Open | Hoffman Gregory C | $22,400 |
Source: Public Records
Tax History
| Year | Tax Paid | Tax Assessment Tax Assessment Total Assessment is a certain percentage of the fair market value that is determined by local assessors to be the total taxable value of land and additions on the property. | Land | Improvement |
|---|---|---|---|---|
| 2025 | $287 | $71,400 | $14,100 | $57,300 |
| 2024 | $287 | $60,600 | $14,100 | $46,500 |
| 2023 | $222 | $53,200 | $10,200 | $43,000 |
| 2022 | $222 | $48,700 | $10,200 | $38,500 |
| 2021 | $215 | $43,100 | $10,200 | $32,900 |
| 2020 | $213 | $41,800 | $10,200 | $31,600 |
| 2019 | $312 | $40,800 | $11,400 | $29,400 |
| 2018 | $302 | $40,400 | $11,400 | $29,000 |
| 2017 | $295 | $40,300 | $11,400 | $28,900 |
| 2016 | $294 | $39,600 | $11,400 | $28,200 |
| 2014 | $191 | $41,500 | $10,000 | $31,500 |
Source: Public Records
Map
Nearby Homes
- 239 E Main St
- 212 Brookview Ln
- 214 E Columbia St
- 117 E Catherine St
- 314 W Vine St
- 625 N State 75 Rd
- 99 Westwood Dr
- 964 E 400 S
- 1026 E 400 S
- 330 E Main St
- 170 S Water St
- 4802 S 20 W
- 342 W Cumberland St
- 375 N Monroe St
- 3520 S 500 E
- 6365 N 260 W
- 3773 E 300 Rd N
- 105 W 8th St
- 00 Washington St
- 1007 S Michigan St
Your Personal Tour Guide
Ask me questions while you tour the home.