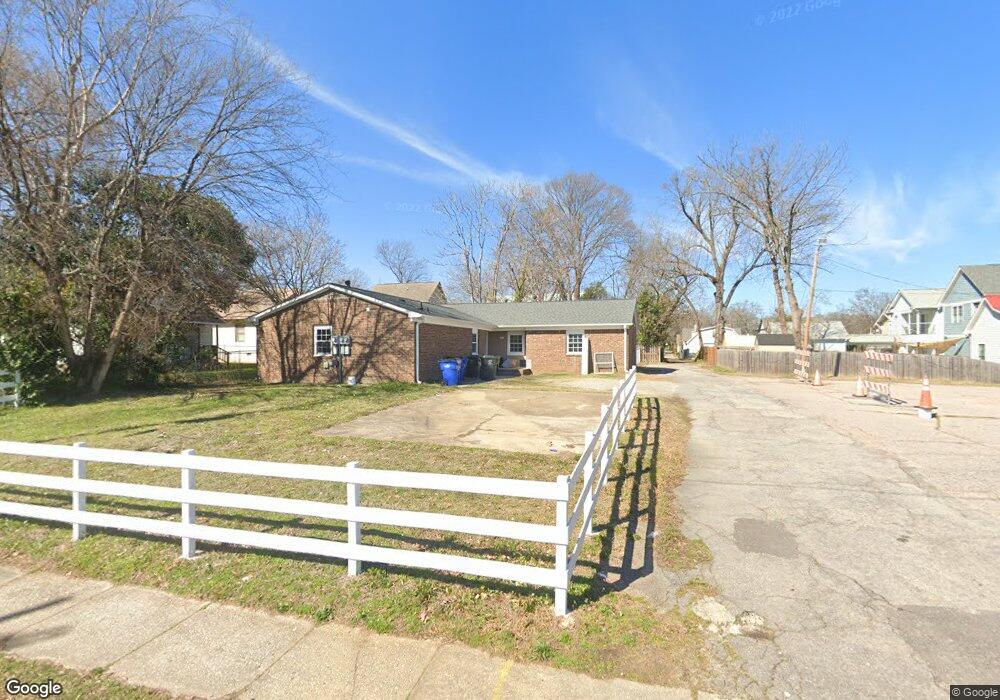
611 E Davie St Raleigh, NC 27601
Olde East Raleigh NeighborhoodEstimated Value: $422,000 - $638,000
--
Bed
3
Baths
2,402
Sq Ft
$226/Sq Ft
Est. Value
About This Home
This home is located at 611 E Davie St, Raleigh, NC 27601 and is currently estimated at $544,000, approximately $226 per square foot. 611 E Davie St is a home located in Wake County with nearby schools including Hunter Elementary School, Ligon Magnet Middle School, and Enloe High.
Ownership History
Date
Name
Owned For
Owner Type
Purchase Details
Closed on
Jun 28, 2021
Sold by
Lee Lillian and Reyes Christopher
Bought by
Tri Again Steel Llc
Current Estimated Value
Home Financials for this Owner
Home Financials are based on the most recent Mortgage that was taken out on this home.
Original Mortgage
$618,375
Outstanding Balance
$109,380
Interest Rate
2.9%
Mortgage Type
Future Advance Clause Open End Mortgage
Estimated Equity
$434,620
Purchase Details
Closed on
May 10, 2011
Sold by
Lee Lillian
Bought by
Lee Lillian and Reyes Christopher
Purchase Details
Closed on
Dec 20, 2007
Sold by
Farmer Johnny T H and Farmer Genevieve M
Bought by
Lee Lillian
Home Financials for this Owner
Home Financials are based on the most recent Mortgage that was taken out on this home.
Original Mortgage
$120,187
Interest Rate
6.21%
Mortgage Type
Purchase Money Mortgage
Create a Home Valuation Report for This Property
The Home Valuation Report is an in-depth analysis detailing your home's value as well as a comparison with similar homes in the area
Home Values in the Area
Average Home Value in this Area
Purchase History
| Date | Buyer | Sale Price | Title Company |
|---|---|---|---|
| Tri Again Steel Llc | $502,000 | None Available | |
| Lee Lillian | -- | None Available | |
| Lee Lillian | $160,500 | None Available |
Source: Public Records
Mortgage History
| Date | Status | Borrower | Loan Amount |
|---|---|---|---|
| Open | Tri Again Steel Llc | $618,375 | |
| Previous Owner | Lee Lillian | $120,187 |
Source: Public Records
Tax History Compared to Growth
Tax History
| Year | Tax Paid | Tax Assessment Tax Assessment Total Assessment is a certain percentage of the fair market value that is determined by local assessors to be the total taxable value of land and additions on the property. | Land | Improvement |
|---|---|---|---|---|
| 2025 | $4,912 | $556,414 | $315,000 | $241,414 |
| 2024 | $4,892 | $556,414 | $315,000 | $241,414 |
| 2023 | $3,385 | $305,028 | $210,000 | $95,028 |
| 2022 | $3,148 | $305,028 | $210,000 | $95,028 |
| 2021 | $3,028 | $305,028 | $210,000 | $95,028 |
| 2020 | $2,974 | $305,028 | $210,000 | $95,028 |
| 2019 | $2,016 | $168,779 | $80,000 | $88,779 |
| 2018 | $1,904 | $168,779 | $80,000 | $88,779 |
| 2017 | $1,816 | $168,779 | $80,000 | $88,779 |
| 2016 | $1,780 | $168,779 | $80,000 | $88,779 |
| 2015 | $1,712 | $159,536 | $44,000 | $115,536 |
| 2014 | $1,626 | $159,536 | $44,000 | $115,536 |
Source: Public Records
Map
Nearby Homes
- 409 Alston St
- 409 Alston St Unit 101
- 409 Alston St Unit 102
- 420 Camden St
- 405 Alston St
- 616 E Cabarrus St
- 706 E Hargett St
- 801 E Martin St Unit B
- 801 E Martin St Unit D
- 801 E Martin St Unit C
- 602 Hay Ln
- 228 Woodsborough Place
- 414 Chavis Way
- 226 Woodsborough Place
- 305 Freeman St
- 501 S Bloodworth St Unit 103
- 501 S Bloodworth St Unit 102
- 511 S Bloodworth St Unit 101
- 204 S State St
- 820 New Bern Ave Unit 820-822-824-826
- 611 E Davie St Unit C
- 611 E Davie St Unit ABC
- 611 E Davie St Unit A
- 313 S Swain St
- 315 S Swain St
- 309 S Swain St
- 322 Haywood St
- 320 Haywood St
- 307 S Swain St
- 318 Haywood St
- 318 Haywood St Unit 66492
- 316 Haywood St
- 305 1/2 S Swain St
- 612 E Davie St
- 316 S Haywood St
- 305 S Swain St
- 608 E Davie St
- 604 E Davie St
- 616 E Davie St
- 600 E Davie St