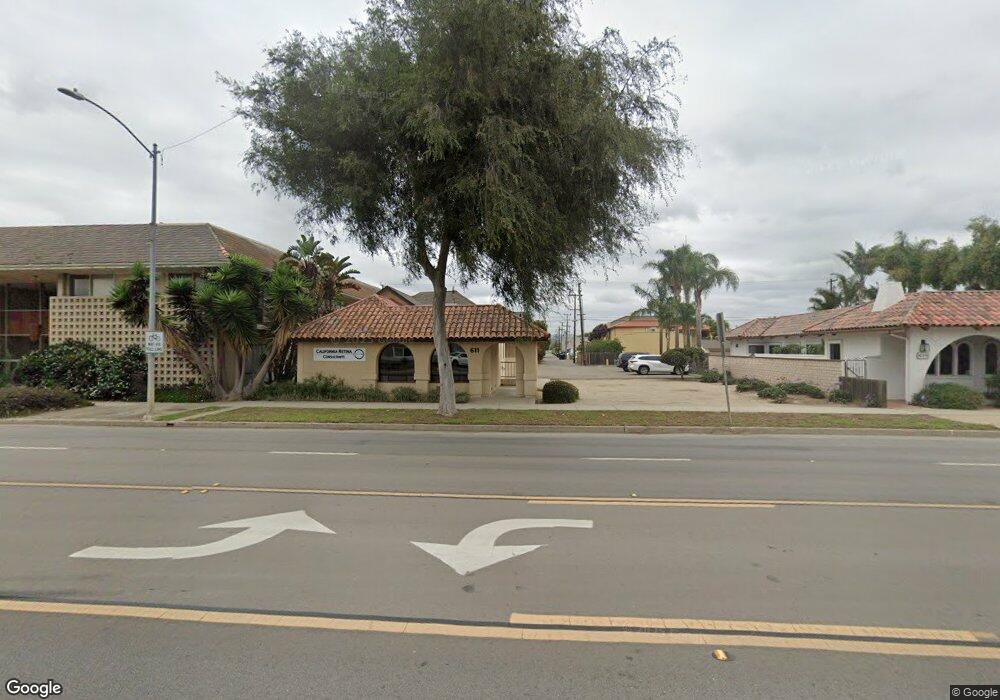
611 E Ocean Ave Lompoc, CA 93436
Estimated Value: $762,854
3
Beds
1
Bath
1,811
Sq Ft
$421/Sq Ft
Est. Value
About This Home
This home is located at 611 E Ocean Ave, Lompoc, CA 93436 and is currently estimated at $762,854, approximately $421 per square foot. 611 E Ocean Ave is a home located in Santa Barbara County with nearby schools including Arthur Hapgood Elementary School, Lompoc Valley Middle School, and Lompoc High School.
Ownership History
Date
Name
Owned For
Owner Type
Purchase Details
Closed on
Mar 16, 2020
Sold by
California Retina Consultants
Bought by
Crc Sb Holdings Inc
Current Estimated Value
Purchase Details
Closed on
May 24, 2011
Sold by
Taketa Daniel R and Taketa Grace J
Bought by
California Retina Consultants
Purchase Details
Closed on
Jun 15, 1998
Sold by
Taketa Daniel R
Bought by
Taketa Daniel R and Taketa Grace J
Home Financials for this Owner
Home Financials are based on the most recent Mortgage that was taken out on this home.
Original Mortgage
$40,000
Interest Rate
7.06%
Mortgage Type
Commercial
Create a Home Valuation Report for This Property
The Home Valuation Report is an in-depth analysis detailing your home's value as well as a comparison with similar homes in the area
Home Values in the Area
Average Home Value in this Area
Purchase History
| Date | Buyer | Sale Price | Title Company |
|---|---|---|---|
| Crc Sb Holdings Inc | -- | Witham Mahoney & Abbott Llp | |
| California Retina Consultants | $300,000 | First American Title Company | |
| Taketa Daniel R | -- | Chicago Title Co |
Source: Public Records
Mortgage History
| Date | Status | Borrower | Loan Amount |
|---|---|---|---|
| Previous Owner | Taketa Daniel R | $40,000 |
Source: Public Records
Tax History
| Year | Tax Paid | Tax Assessment Tax Assessment Total Assessment is a certain percentage of the fair market value that is determined by local assessors to be the total taxable value of land and additions on the property. | Land | Improvement |
|---|---|---|---|---|
| 2025 | $4,583 | $415,738 | $160,142 | $255,596 |
| 2023 | $4,583 | $399,596 | $153,924 | $245,672 |
| 2022 | $4,503 | $391,761 | $150,906 | $240,855 |
| 2021 | $4,550 | $384,081 | $147,948 | $236,133 |
| 2020 | $4,502 | $380,143 | $146,431 | $233,712 |
| 2019 | $4,427 | $372,690 | $143,560 | $229,130 |
| 2018 | $4,359 | $365,389 | $140,746 | $224,643 |
| 2017 | $4,279 | $358,226 | $137,987 | $220,239 |
| 2016 | $4,202 | $351,203 | $135,282 | $215,921 |
| 2014 | $4,113 | $339,152 | $130,640 | $208,512 |
Source: Public Records
Map
Nearby Homes
Your Personal Tour Guide
Ask me questions while you tour the home.