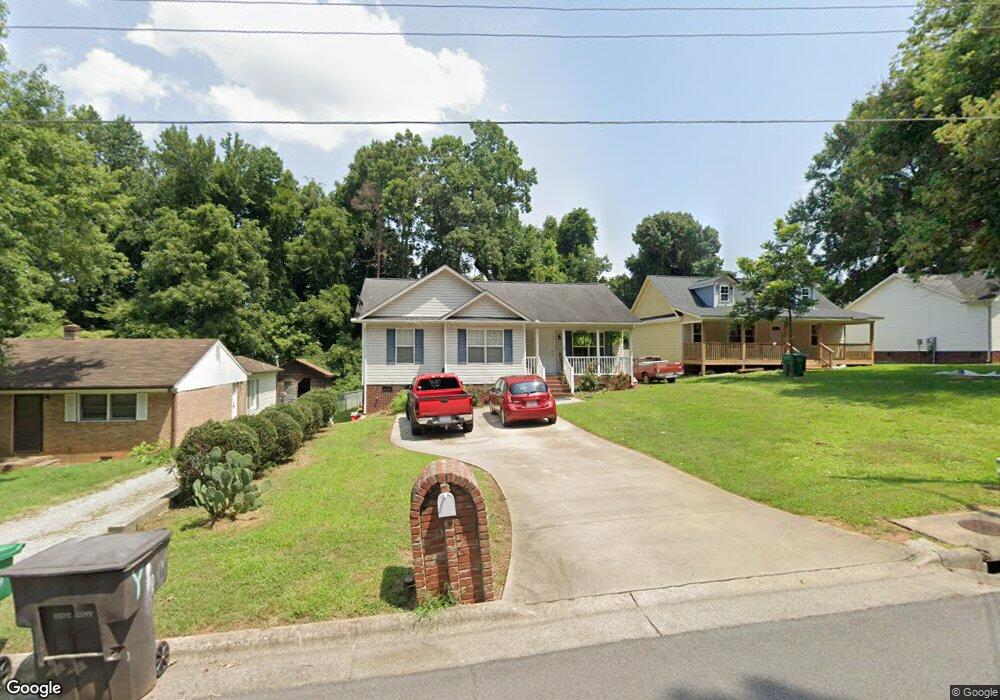
611 Manley St High Point, NC 27260
Greater High Point NeighborhoodEstimated Value: $167,000 - $190,000
3
Beds
2
Baths
1,144
Sq Ft
$156/Sq Ft
Est. Value
About This Home
This home is located at 611 Manley St, High Point, NC 27260 and is currently estimated at $178,969, approximately $156 per square foot. 611 Manley St is a home located in Guilford County with nearby schools including Fairview Elementary School, Ferndale Middle School, and High Point Central High School.
Ownership History
Date
Name
Owned For
Owner Type
Purchase Details
Closed on
May 21, 2004
Sold by
Nall Timothy R and Nall Terry R
Bought by
Yanez Lucero S and Yanez Pablo
Current Estimated Value
Home Financials for this Owner
Home Financials are based on the most recent Mortgage that was taken out on this home.
Original Mortgage
$87,526
Outstanding Balance
$42,418
Interest Rate
5.98%
Mortgage Type
FHA
Estimated Equity
$136,551
Purchase Details
Closed on
Jul 1, 2003
Sold by
Robison William and Robison Nancy
Bought by
Nall Timothy and Nall Terry R
Home Financials for this Owner
Home Financials are based on the most recent Mortgage that was taken out on this home.
Original Mortgage
$70,000
Interest Rate
5.29%
Mortgage Type
Construction
Create a Home Valuation Report for This Property
The Home Valuation Report is an in-depth analysis detailing your home's value as well as a comparison with similar homes in the area
Home Values in the Area
Average Home Value in this Area
Purchase History
| Date | Buyer | Sale Price | Title Company |
|---|---|---|---|
| Yanez Lucero S | $89,000 | -- | |
| Nall Timothy | $5,000 | -- |
Source: Public Records
Mortgage History
| Date | Status | Borrower | Loan Amount |
|---|---|---|---|
| Open | Yanez Lucero S | $87,526 | |
| Previous Owner | Nall Timothy | $70,000 |
Source: Public Records
Tax History
| Year | Tax Paid | Tax Assessment Tax Assessment Total Assessment is a certain percentage of the fair market value that is determined by local assessors to be the total taxable value of land and additions on the property. | Land | Improvement |
|---|---|---|---|---|
| 2025 | $1,469 | $106,600 | $10,000 | $96,600 |
| 2024 | $1,469 | $106,600 | $10,000 | $96,600 |
| 2023 | $1,469 | $106,600 | $10,000 | $96,600 |
| 2022 | $1,437 | $106,600 | $10,000 | $96,600 |
| 2021 | $1,253 | $90,900 | $8,000 | $82,900 |
| 2020 | $1,253 | $90,900 | $8,000 | $82,900 |
| 2019 | $1,253 | $90,900 | $0 | $0 |
| 2018 | $1,246 | $90,900 | $0 | $0 |
| 2017 | $1,253 | $90,900 | $0 | $0 |
| 2016 | $1,265 | $90,200 | $0 | $0 |
| 2015 | $1,272 | $90,200 | $0 | $0 |
| 2014 | $1,293 | $90,200 | $0 | $0 |
Source: Public Records
Map
Nearby Homes
- 1111 Winslow St
- 1914 E Russell Ave
- 1806 Franklin Ave
- 1110 Worth St
- 1809 Franklin Ave
- 430 New St
- 2317 Purdy Ave
- 640 Wesley Dr
- 650 Wesley Dr
- 811 Worth St
- 1908 Leonard Ave
- 1314 Franklin Ave
- 1423 E Commerce Ave
- 1422 Valley Ridge Dr
- 709 Habersham Rd
- 1103 Jefferson St
- 335 Nathan Hunt Dr
- 1012 Jefferson St
- 2814 Triangle Lake Rd
- 812 E Russell Ave
Your Personal Tour Guide
Ask me questions while you tour the home.