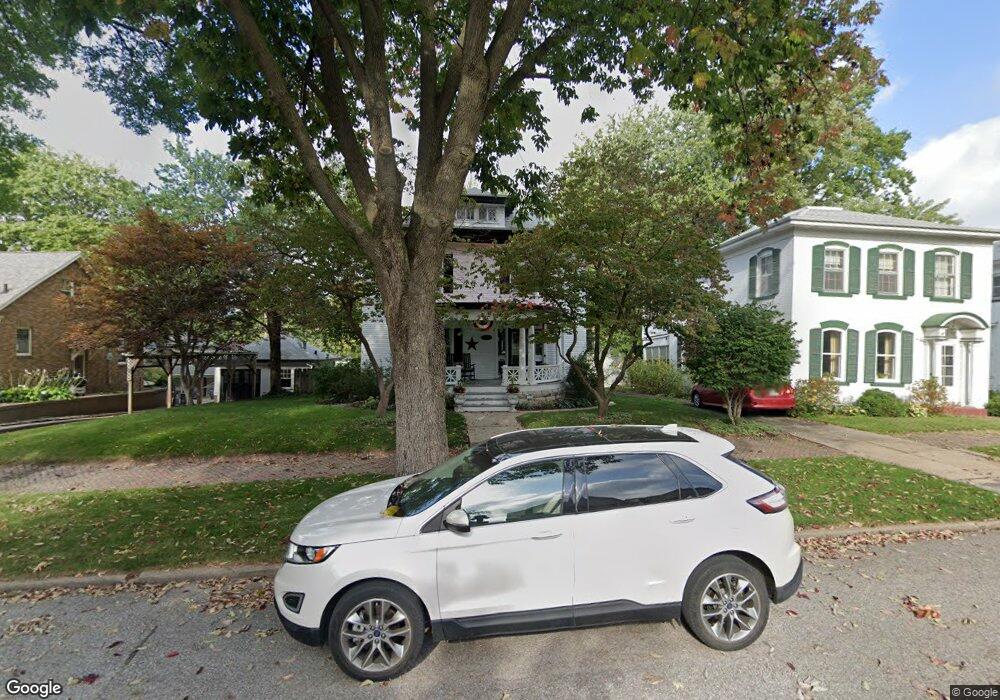
611 N 7th St Burlington, IA 52601
Estimated Value: $140,000 - $179,000
4
Beds
2
Baths
2,160
Sq Ft
$73/Sq Ft
Est. Value
About This Home
This home is located at 611 N 7th St, Burlington, IA 52601 and is currently estimated at $157,952, approximately $73 per square foot. 611 N 7th St is a home located in Des Moines County with nearby schools including Burlington Community High School, Great River Christian School, and Burlington Christian School.
Ownership History
Date
Name
Owned For
Owner Type
Purchase Details
Closed on
Aug 3, 2018
Sold by
Zick Warren R and Zick Rosalind
Bought by
Zick Ft
Current Estimated Value
Purchase Details
Closed on
Mar 9, 2011
Sold by
Federal National Mortgage Association
Bought by
Zick Warren R and Zick Rosalind
Home Financials for this Owner
Home Financials are based on the most recent Mortgage that was taken out on this home.
Original Mortgage
$64,000
Interest Rate
4.88%
Mortgage Type
New Conventional
Purchase Details
Closed on
Aug 18, 2010
Sold by
Henrie Corey Thomas and Henrie Corey T
Bought by
Chase Home Finance Llc
Purchase Details
Closed on
May 18, 2007
Sold by
Yaeger Daniel C and Yaeger Melanie D
Bought by
Henrie Corey T
Home Financials for this Owner
Home Financials are based on the most recent Mortgage that was taken out on this home.
Original Mortgage
$125,200
Interest Rate
6.22%
Mortgage Type
New Conventional
Create a Home Valuation Report for This Property
The Home Valuation Report is an in-depth analysis detailing your home's value as well as a comparison with similar homes in the area
Home Values in the Area
Average Home Value in this Area
Purchase History
| Date | Buyer | Sale Price | Title Company |
|---|---|---|---|
| Zick Ft | -- | -- | |
| Zick Warren R | $80,000 | -- | |
| Chase Home Finance Llc | $155,561 | -- | |
| Henrie Corey T | $156,500 | None Available |
Source: Public Records
Mortgage History
| Date | Status | Borrower | Loan Amount |
|---|---|---|---|
| Previous Owner | Zick Warren R | $64,000 | |
| Previous Owner | Henrie Corey T | $125,200 |
Source: Public Records
Tax History Compared to Growth
Tax History
| Year | Tax Paid | Tax Assessment Tax Assessment Total Assessment is a certain percentage of the fair market value that is determined by local assessors to be the total taxable value of land and additions on the property. | Land | Improvement |
|---|---|---|---|---|
| 2025 | $2,680 | $166,400 | $18,800 | $147,600 |
| 2024 | $2,680 | $146,400 | $18,800 | $127,600 |
| 2023 | $2,660 | $146,400 | $18,800 | $127,600 |
| 2022 | $2,702 | $136,100 | $18,800 | $117,300 |
| 2021 | $2,702 | $136,100 | $18,800 | $117,300 |
| 2020 | $2,880 | $136,100 | $18,800 | $117,300 |
| 2019 | $2,688 | $136,100 | $18,800 | $117,300 |
| 2018 | $2,692 | $120,100 | $21,800 | $98,300 |
| 2017 | $2,692 | $115,100 | $0 | $0 |
| 2016 | $2,546 | $115,100 | $0 | $0 |
| 2015 | $2,546 | $115,100 | $0 | $0 |
| 2014 | $2,578 | $115,000 | $0 | $0 |
Source: Public Records
Map
Nearby Homes