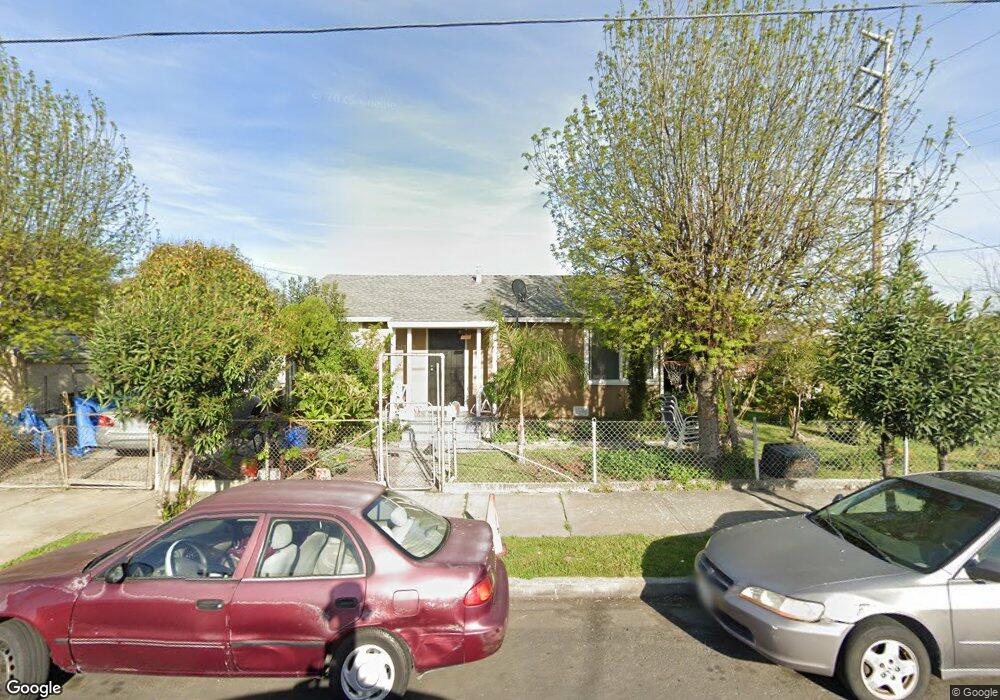
611 O St Antioch, CA 94509
North Antioch NeighborhoodEstimated Value: $381,391 - $437,000
2
Beds
1
Bath
978
Sq Ft
$409/Sq Ft
Est. Value
About This Home
This home is located at 611 O St, Antioch, CA 94509 and is currently estimated at $399,598, approximately $408 per square foot. 611 O St is a home located in Contra Costa County with nearby schools including Fremont Elementary School, Antioch Middle School, and Antioch High School.
Ownership History
Date
Name
Owned For
Owner Type
Purchase Details
Closed on
Oct 11, 2006
Sold by
Pelayo Eva M
Bought by
Pelayo Eva M and Pelayo Adriana M
Current Estimated Value
Purchase Details
Closed on
Jan 18, 2001
Sold by
Eva Pelayo and Eva M
Bought by
Pelayo Eva M
Home Financials for this Owner
Home Financials are based on the most recent Mortgage that was taken out on this home.
Original Mortgage
$105,000
Interest Rate
7.41%
Mortgage Type
Purchase Money Mortgage
Create a Home Valuation Report for This Property
The Home Valuation Report is an in-depth analysis detailing your home's value as well as a comparison with similar homes in the area
Home Values in the Area
Average Home Value in this Area
Purchase History
| Date | Buyer | Sale Price | Title Company |
|---|---|---|---|
| Pelayo Eva M | -- | None Available | |
| Pelayo Eva M | -- | Fidelity National Title |
Source: Public Records
Mortgage History
| Date | Status | Borrower | Loan Amount |
|---|---|---|---|
| Closed | Pelayo Eva M | $105,000 |
Source: Public Records
Tax History
| Year | Tax Paid | Tax Assessment Tax Assessment Total Assessment is a certain percentage of the fair market value that is determined by local assessors to be the total taxable value of land and additions on the property. | Land | Improvement |
|---|---|---|---|---|
| 2025 | $1,566 | $95,428 | $43,273 | $52,155 |
| 2024 | $1,457 | $93,558 | $42,425 | $51,133 |
| 2023 | $1,457 | $91,725 | $41,594 | $50,131 |
| 2022 | $2,452 | $89,928 | $40,779 | $49,149 |
| 2021 | $1,382 | $88,166 | $39,980 | $48,186 |
| 2019 | $1,337 | $85,553 | $38,796 | $46,757 |
| 2018 | $1,288 | $83,877 | $38,036 | $45,841 |
| 2017 | $1,247 | $82,234 | $37,291 | $44,943 |
| 2016 | $1,200 | $80,622 | $36,560 | $44,062 |
| 2015 | $1,175 | $79,412 | $36,011 | $43,401 |
| 2014 | $1,133 | $77,857 | $35,306 | $42,551 |
Source: Public Records
Map
Nearby Homes
- 1112 W 6th St
- 0 W 4th St
- 1405 Tulip Dr
- 809 W 2nd St
- 1143 Cook St
- 811 G St Unit 811 and 811 1/2
- 810 F St
- 504 W 10th St
- 1508 Sycamore Dr
- 1504 Sycamore Dr
- 613 W 13th St
- 1110 F St
- 1214 Sycamore Dr Unit 3
- 2104 Lemontree Way Unit 1
- 301 W 3rd St
- 2110 Peppertree Way Unit 1
- 310 W 10th St
- 2208 Spanos St
- 2118 Peppertree Way Unit 4
- 2118 Peppertree Way Unit 1