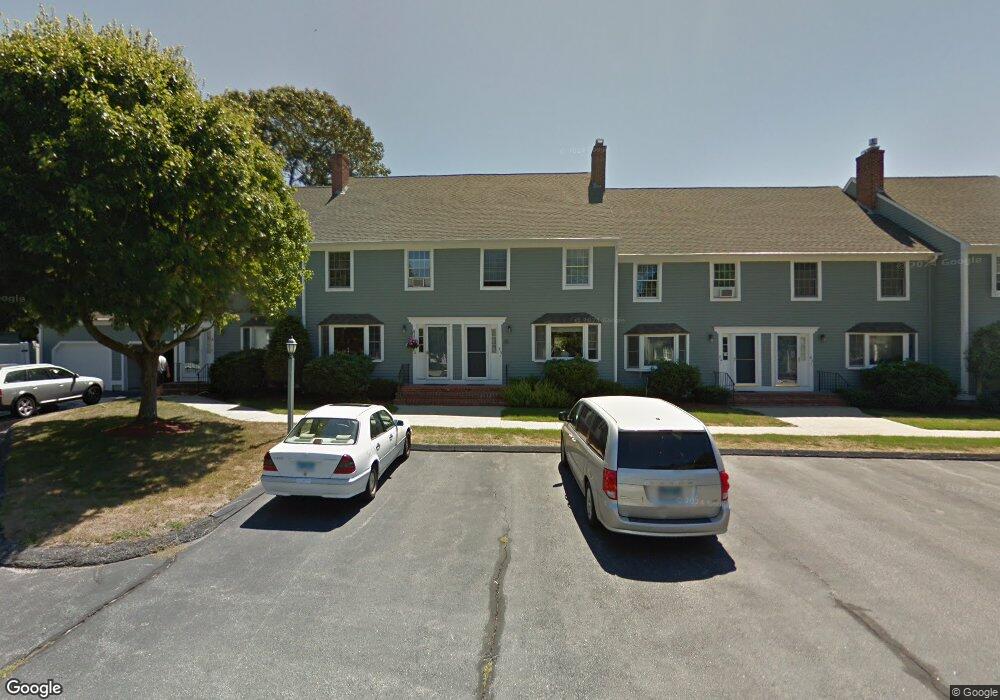
611 Ocean Ave Unit A1 New London, CT 06320
South New London NeighborhoodEstimated Value: $321,833 - $363,000
2
Beds
3
Baths
1,728
Sq Ft
$194/Sq Ft
Est. Value
About This Home
This home is located at 611 Ocean Ave Unit A1, New London, CT 06320 and is currently estimated at $335,708, approximately $194 per square foot. 611 Ocean Ave Unit A1 is a home located in New London County with nearby schools including Harbor Elementary School, Bennie Dover Jackson Middle School, and New London High School.
Ownership History
Date
Name
Owned For
Owner Type
Purchase Details
Closed on
Aug 1, 2023
Sold by
Crespo Tony
Bought by
Kinsey Lakeisha R
Current Estimated Value
Purchase Details
Closed on
Jun 30, 2005
Sold by
Bonelli Cecilla
Bought by
Selvidio Diane
Home Financials for this Owner
Home Financials are based on the most recent Mortgage that was taken out on this home.
Original Mortgage
$182,500
Interest Rate
5.73%
Mortgage Type
Purchase Money Mortgage
Purchase Details
Closed on
Sep 25, 2001
Sold by
Holder Larry D
Bought by
Bonelli Cecilia D
Create a Home Valuation Report for This Property
The Home Valuation Report is an in-depth analysis detailing your home's value as well as a comparison with similar homes in the area
Home Values in the Area
Average Home Value in this Area
Purchase History
| Date | Buyer | Sale Price | Title Company |
|---|---|---|---|
| Kinsey Lakeisha R | -- | None Available | |
| Selvidio Diane | $267,500 | -- | |
| Bonelli Cecilia D | $159,000 | -- |
Source: Public Records
Mortgage History
| Date | Status | Borrower | Loan Amount |
|---|---|---|---|
| Previous Owner | Bonelli Cecilia D | $160,534 | |
| Previous Owner | Bonelli Cecilia D | $182,500 | |
| Previous Owner | Bonelli Cecilia D | $20,000 | |
| Previous Owner | Bonelli Cecilia D | $198,400 |
Source: Public Records
Tax History Compared to Growth
Tax History
| Year | Tax Paid | Tax Assessment Tax Assessment Total Assessment is a certain percentage of the fair market value that is determined by local assessors to be the total taxable value of land and additions on the property. | Land | Improvement |
|---|---|---|---|---|
| 2025 | $4,896 | $180,000 | $0 | $180,000 |
| 2024 | $4,950 | $180,000 | $0 | $180,000 |
| 2023 | $4,557 | $122,360 | $0 | $122,360 |
| 2022 | $4,565 | $122,360 | $0 | $122,360 |
| 2021 | $4,644 | $122,360 | $0 | $122,360 |
| 2020 | $4,673 | $122,360 | $0 | $122,360 |
| 2019 | $4,882 | $122,360 | $0 | $122,360 |
| 2018 | $5,560 | $127,120 | $0 | $127,120 |
| 2017 | $5,626 | $127,120 | $0 | $127,120 |
| 2016 | $5,143 | $127,120 | $0 | $127,120 |
| 2015 | $5,020 | $127,120 | $0 | $127,120 |
| 2014 | $4,356 | $127,120 | $0 | $127,120 |
Source: Public Records
Map
Nearby Homes
- 57 Westridge Rd Unit B2
- 165 Plant St
- 57 Farmington Ave
- 142 Plant St
- 194 Thames St
- 214 Thames St
- 19 Dart St
- 41 Niles Hill Rd
- 107 Niles Hill Rd Unit A
- 113 Niles Hill Rd Unit F
- 111 Niles Hill Rd Unit B
- 541 Montauk Ave
- 25 Menghi St
- 35 Menghi St
- 51 Thames St
- 845 Ocean Ave
- 20 Harris Rd
- 2 Maginnis Pkwy
- 184 Pequot Ave Unit 104
- 16 Bellevue Place
- 611 Ocean Ave Unit G5
- 611 Ocean Ave Unit A4
- 611 Ocean Ave Unit B3
- 611 Ocean Ave Unit E4
- 611 Ocean Ave Unit D2
- 611 Ocean Ave Unit G2
- 611 Ocean Ave Unit F1
- 611 Ocean Ave Unit A5
- 611 Ocean Ave Unit E1
- 611 Ocean Ave Unit D4
- 611 Ocean Ave Unit B4
- 611 Ocean Ave Unit E5
- 611 Ocean Ave Unit F4
- 611 Ocean Ave Unit G6
- 611 Ocean Ave Unit G4
- 611 Ocean Ave Unit G3
- 611 Ocean Ave Unit G1
- 611 Ocean Ave Unit F3
- 611 Ocean Ave Unit F2
- 611 Ocean Ave Unit E6