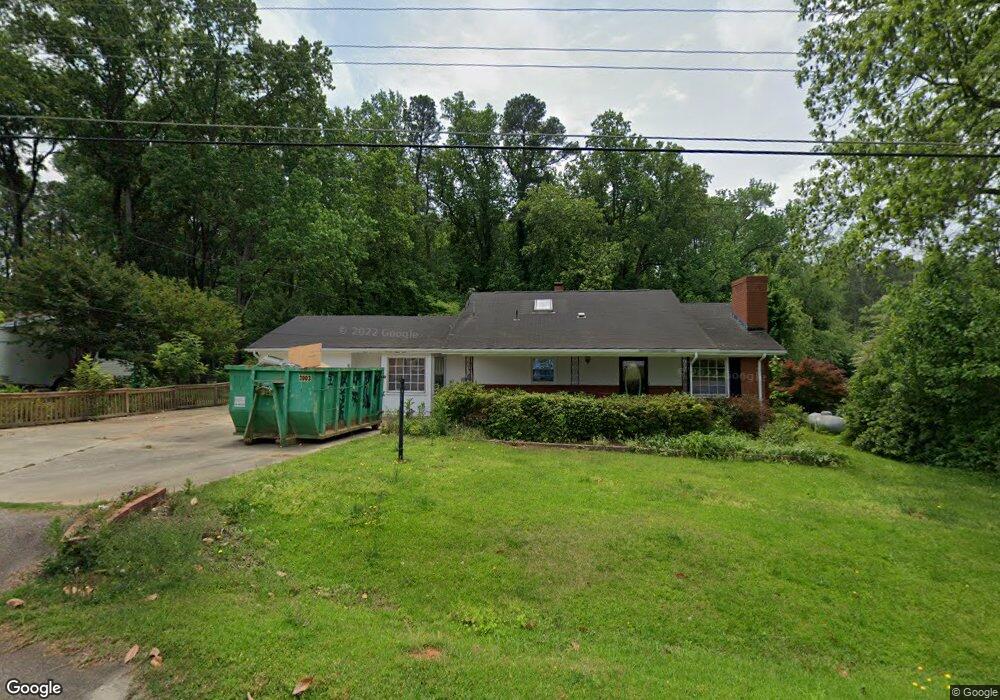
611 Ranch Farm Rd Raleigh, NC 27603
Estimated Value: $358,000 - $450,000
3
Beds
2
Baths
1,932
Sq Ft
$204/Sq Ft
Est. Value
About This Home
This home is located at 611 Ranch Farm Rd, Raleigh, NC 27603 and is currently estimated at $394,442, approximately $204 per square foot. 611 Ranch Farm Rd is a home located in Wake County with nearby schools including Smith Elementary, North Garner Middle, and Garner High.
Ownership History
Date
Name
Owned For
Owner Type
Purchase Details
Closed on
Jun 12, 2019
Sold by
Ranch Farm Llc
Bought by
Jones Jesse H
Current Estimated Value
Purchase Details
Closed on
Mar 29, 2019
Sold by
Jones Jesse H and Jones Laura A
Bought by
Ranch Farm Llc
Purchase Details
Closed on
Mar 22, 2018
Sold by
Fowler Stewart A and Estate Of Joy Neta Jones
Bought by
Jones Jesse H and Jones Laura A
Home Financials for this Owner
Home Financials are based on the most recent Mortgage that was taken out on this home.
Original Mortgage
$128,000
Interest Rate
4.32%
Mortgage Type
New Conventional
Purchase Details
Closed on
Dec 20, 2007
Sold by
Jones Gordon L and Jones Peggy F
Bought by
Jones Joy Neta
Create a Home Valuation Report for This Property
The Home Valuation Report is an in-depth analysis detailing your home's value as well as a comparison with similar homes in the area
Home Values in the Area
Average Home Value in this Area
Purchase History
| Date | Buyer | Sale Price | Title Company |
|---|---|---|---|
| Jones Jesse H | -- | None Available | |
| Ranch Farm Llc | -- | None Available | |
| Ranch Farm Llc | -- | None Listed On Document | |
| Jones Jesse H | $160,000 | None Available | |
| Jones Joy Neta | -- | None Available |
Source: Public Records
Mortgage History
| Date | Status | Borrower | Loan Amount |
|---|---|---|---|
| Previous Owner | Jones Jesse H | $128,000 |
Source: Public Records
Tax History Compared to Growth
Tax History
| Year | Tax Paid | Tax Assessment Tax Assessment Total Assessment is a certain percentage of the fair market value that is determined by local assessors to be the total taxable value of land and additions on the property. | Land | Improvement |
|---|---|---|---|---|
| 2025 | $2,538 | $393,673 | $120,000 | $273,673 |
| 2024 | $2,465 | $393,673 | $120,000 | $273,673 |
| 2023 | $1,528 | $193,373 | $48,000 | $145,373 |
| 2022 | $1,417 | $193,373 | $48,000 | $145,373 |
| 2021 | $1,379 | $193,373 | $48,000 | $145,373 |
| 2020 | $1,356 | $193,373 | $48,000 | $145,373 |
| 2019 | $1,148 | $138,107 | $30,000 | $108,107 |
| 2018 | $1,056 | $138,107 | $30,000 | $108,107 |
| 2017 | $1,002 | $138,107 | $30,000 | $108,107 |
| 2016 | $982 | $138,107 | $30,000 | $108,107 |
| 2015 | -- | $148,498 | $40,000 | $108,498 |
| 2014 | -- | $148,498 | $40,000 | $108,498 |
Source: Public Records
Map
Nearby Homes
- 5107 Overhill St
- 612 Locust Ln
- 721 Grovemont Rd
- 327 Ranch Farm Rd
- 325 Ranch Farm Rd Unit A / B
- 323 Ranch Farm Rd
- 5504 Balsam Place
- 5108 Old Valley St
- 725 Colonial Dr
- 4901 Comelia Dr
- 612 Lakeview Dr
- 5515 Spring Rd
- 5716 Spring Rd
- 5505 Spring Rd
- 1343 Old Buckhorn Rd
- 4408 Parkwood Dr
- Lot 32 Bent Pine Place
- 1210 Shadowbark Ct
- 200 Longneedle Ct
- 826 Oakwater Dr
- 609 Ranch Farm Rd
- 615 Ranch Farm Rd
- 304 Ranch Farm Rd
- 300 Ranch Farm Rd
- 330 Ranch Farm Rd
- 5122 Overhill St
- 619 Ranch Farm Rd
- 5118 Overhill St
- 525 Ranch Farm Rd
- 712 Elmwood Dr
- 526 Ranch Farm Rd
- 700 Ranch Farm Rd
- 5108 Overhill St
- 521 Ranch Farm Rd
- 709 Elmwood Dr
- 5122 Midland St
- 701 Ranch Farm Rd
- 5404 Holly Cir
- 714 Elmwood Dr
- 515 Ranch Farm Rd