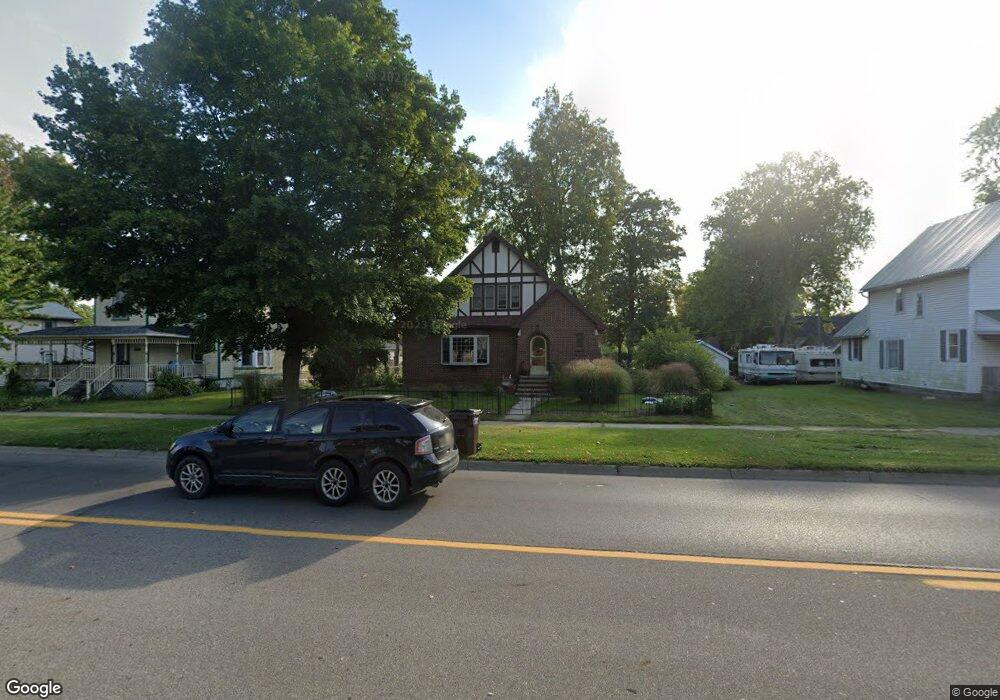
611 S Main St Eaton Rapids, MI 48827
Estimated Value: $222,000 - $243,000
3
Beds
3
Baths
1,965
Sq Ft
$118/Sq Ft
Est. Value
About This Home
This home is located at 611 S Main St, Eaton Rapids, MI 48827 and is currently estimated at $232,366, approximately $118 per square foot. 611 S Main St is a home located in Eaton County with nearby schools including Lockwood Elementary School, Greyhound Intermediate School, and Eaton Rapids Middle School.
Ownership History
Date
Name
Owned For
Owner Type
Purchase Details
Closed on
Feb 1, 2021
Sold by
Olson Veronika and Estate Of Russel H Olson
Bought by
Olson Veronika and Olson Ruslan E
Current Estimated Value
Purchase Details
Closed on
Apr 9, 2004
Sold by
Olson Herbert W and Olson Mary L
Bought by
Olson Russel H
Home Financials for this Owner
Home Financials are based on the most recent Mortgage that was taken out on this home.
Original Mortgage
$127,920
Outstanding Balance
$60,198
Interest Rate
5.66%
Mortgage Type
Purchase Money Mortgage
Estimated Equity
$172,168
Purchase Details
Closed on
May 12, 2003
Sold by
Gubry Charles F and Gubry Judy K
Bought by
Olson Herbert W and Olson Mary L
Home Financials for this Owner
Home Financials are based on the most recent Mortgage that was taken out on this home.
Original Mortgage
$127,920
Interest Rate
5.87%
Mortgage Type
Purchase Money Mortgage
Create a Home Valuation Report for This Property
The Home Valuation Report is an in-depth analysis detailing your home's value as well as a comparison with similar homes in the area
Home Values in the Area
Average Home Value in this Area
Purchase History
We collect this data history from publicly available records. To have your information removed, we recommend requesting removal directly through your county’s website.
| Date | Buyer | Sale Price | Title Company |
|---|---|---|---|
| Olson Veronika | -- | None Available | |
| Olson Russel H | $159,900 | Michigan Title Company | |
| Olson Herbert W | $159,900 | Metropolitan Title Company |
Source: Public Records
Mortgage History
We collect this data history from publicly available records. To have your information removed, we recommend requesting removal directly through your county’s website.
| Date | Status | Borrower | Loan Amount |
|---|---|---|---|
| Open | Olson Russel H | $127,920 | |
| Closed | Olson Herbert W | $127,920 |
Source: Public Records
Tax History
| Year | Tax Paid | Tax Assessment Tax Assessment Total Assessment is a certain percentage of the fair market value that is determined by local assessors to be the total taxable value of land and additions on the property. | Land | Improvement |
|---|---|---|---|---|
| 2025 | $3,297 | $120,200 | $0 | $0 |
| 2024 | $2,324 | $113,400 | $0 | $0 |
| 2023 | $2,348 | $100,700 | $0 | $0 |
| 2022 | $3,191 | $89,200 | $0 | $0 |
| 2021 | $4,386 | $82,000 | $0 | $0 |
| 2020 | $3,049 | $80,100 | $0 | $0 |
| 2019 | $3,008 | $70,848 | $0 | $0 |
| 2018 | $2,938 | $75,192 | $0 | $0 |
| 2017 | $2,811 | $72,300 | $0 | $0 |
| 2016 | -- | $68,550 | $0 | $0 |
| 2015 | -- | $66,550 | $0 | $0 |
| 2014 | -- | $65,250 | $0 | $0 |
| 2013 | -- | $64,850 | $0 | $0 |
Source: Public Records
Map
Nearby Homes
- 502 S Main St
- 208 Dutton St
- 311 W Broad St
- 125 State St
- 405 S East St
- 311 Dutton St
- V/L Chester St
- 618 Forest St
- 615 Jennie St
- 608 Jennie St
- 101 S East St
- 680 N Gallery Dr
- 984 Tyler Dr Unit 68
- 539 Harwood Ct Unit 134
- 634 State St
- 108 Meath Rd
- 123 Frost St
- 116 N Center St
- 501 Carlisle St
- 411 Crane St
Your Personal Tour Guide
Ask me questions while you tour the home.