Estimated Value: $202,000 - $261,000
2
Beds
1
Bath
1,280
Sq Ft
$182/Sq Ft
Est. Value
About This Home
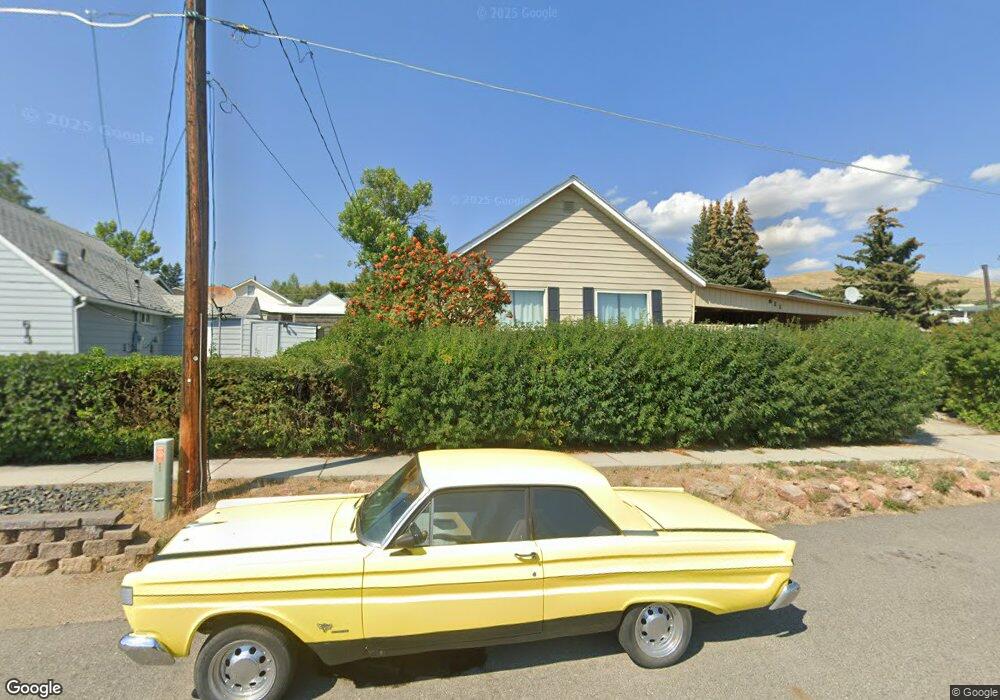
This home is located at 611 Transit St, Butte, MT 59701 and is currently estimated at $233,210, approximately $182 per square foot. 611 Transit St is a home located in Silver Bow County with nearby schools including Kennedy Elementary School, East Middle School, and Butte High School.
Ownership History
Date
Name
Owned For
Owner Type
Purchase Details
Closed on
Nov 22, 2013
Sold by
Popovich Kelly and Lewis Kelly
Bought by
Corbin Gary
Current Estimated Value
Purchase Details
Closed on
Sep 10, 2009
Sold by
Lewis Glenn
Bought by
Lewis Kelly A
Purchase Details
Closed on
Aug 25, 2009
Sold by
Corbitt Joseph A
Bought by
Lewis Kelly A
Purchase Details
Closed on
Aug 20, 2009
Sold by
Corbitt Daniel J
Bought by
Lewis Kelly A
Purchase Details
Closed on
Aug 18, 2009
Sold by
Lewis Glenn and Lewis Mary June
Bought by
Lewis Kelly A
Purchase Details
Closed on
Aug 11, 2009
Sold by
Lewis Mary June and Lewis Glen
Bought by
Lewis Glen
Create a Home Valuation Report for This Property
The Home Valuation Report is an in-depth analysis detailing your home's value as well as a comparison with similar homes in the area
Purchase History
| Date | Buyer | Sale Price | Title Company |
|---|---|---|---|
| Corbin Gary | -- | None Available | |
| Lewis Kelly A | -- | -- | |
| Lewis Kelly A | -- | -- | |
| Lewis Kelly A | -- | -- | |
| Lewis Kelly A | -- | -- | |
| Lewis Glen | -- | -- |
Source: Public Records
Tax History
| Year | Tax Paid | Tax Assessment Tax Assessment Total Assessment is a certain percentage of the fair market value that is determined by local assessors to be the total taxable value of land and additions on the property. | Land | Improvement |
|---|---|---|---|---|
| 2025 | $1,793 | $230,700 | $0 | $0 |
| 2024 | $1,879 | $170,600 | $0 | $0 |
| 2023 | $1,872 | $170,600 | $0 | $0 |
| 2022 | $1,528 | $101,500 | $0 | $0 |
| 2021 | $1,128 | $101,500 | $0 | $0 |
| 2020 | $1,340 | $76,500 | $0 | $0 |
| 2019 | $1,232 | $76,500 | $0 | $0 |
| 2018 | $1,204 | $74,700 | $0 | $0 |
| 2017 | $742 | $74,700 | $0 | $0 |
| 2016 | $1,125 | $74,600 | $0 | $0 |
| 2015 | $777 | $74,600 | $0 | $0 |
| 2014 | $1,105 | $40,100 | $0 | $0 |
Source: Public Records
Map
Nearby Homes
- LOT 5th St
- TBD Daly St W
- 1215 N Excelsior Ave
- Lot 6B and Lot 8 W Pearl St
- 21 Oneil St
- 816 Waukesha St
- tbd Sunview Terrace
- 104 E Center St
- 34 E Summit St
- 554 N Franklin St
- 1022 Lewisohn St
- 625 N Main St
- 925 W Woolman St
- 1009 Caledonia St
- Lots 5-6 W Copper St
- TBD W Copper St
- 315 N Washington St
- 905 W Copper St
- 1000 Caledonia St
- 305 N Alaska Unit N- 0b St
Your Personal Tour Guide
Ask me questions while you tour the home.