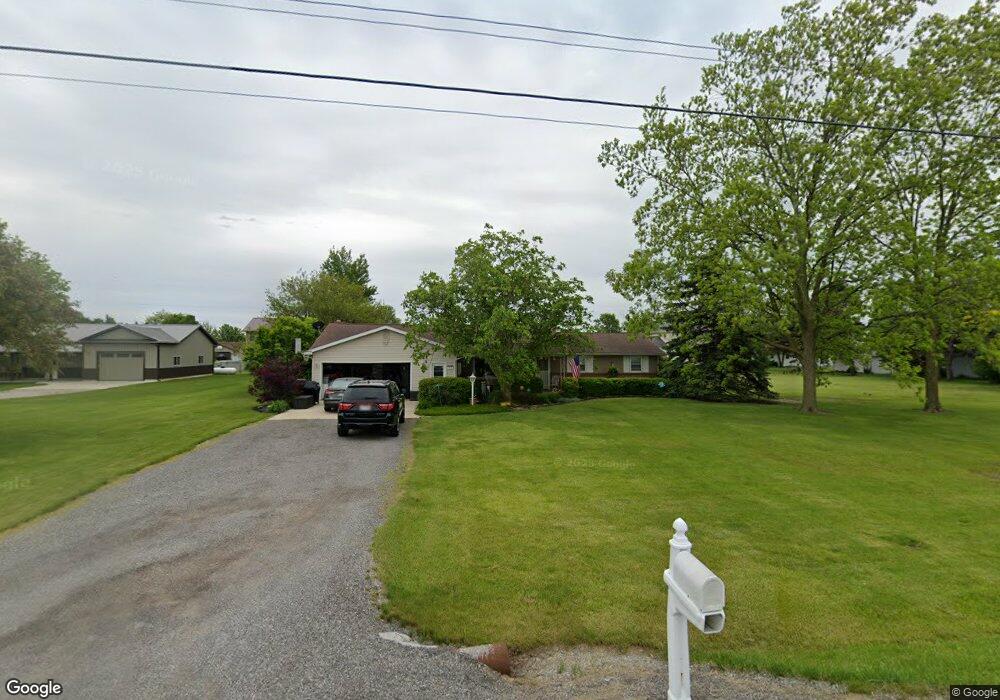
611 W Gasser Rd Paulding, OH 45879
Estimated Value: $164,000 - $190,000
3
Beds
2
Baths
1,444
Sq Ft
$125/Sq Ft
Est. Value
About This Home
This home is located at 611 W Gasser Rd, Paulding, OH 45879 and is currently estimated at $179,828, approximately $124 per square foot. 611 W Gasser Rd is a home located in Paulding County with nearby schools including Paulding High School.
Ownership History
Date
Name
Owned For
Owner Type
Purchase Details
Closed on
Sep 20, 2020
Sold by
Schweller Todd J and Schweller Kristie N
Bought by
Martinez Oswaldo and Martinez Valerie A
Current Estimated Value
Home Financials for this Owner
Home Financials are based on the most recent Mortgage that was taken out on this home.
Original Mortgage
$112,917
Interest Rate
2.8%
Mortgage Type
FHA
Purchase Details
Closed on
May 30, 2013
Sold by
Schweller Stephanie
Bought by
Schweller Todd J
Purchase Details
Closed on
Aug 24, 2009
Sold by
Schweller Todd J and Schweller Stephanie
Bought by
Schweller Todd J and Schweller Stephanie
Purchase Details
Closed on
Oct 19, 1998
Bought by
Schweller Todd J
Create a Home Valuation Report for This Property
The Home Valuation Report is an in-depth analysis detailing your home's value as well as a comparison with similar homes in the area
Home Values in the Area
Average Home Value in this Area
Purchase History
| Date | Buyer | Sale Price | Title Company |
|---|---|---|---|
| Martinez Oswaldo | $115,000 | None Available | |
| Schweller Todd J | -- | None Available | |
| Schweller Todd J | -- | None Available | |
| Schweller Todd J | $68,000 | -- |
Source: Public Records
Mortgage History
| Date | Status | Borrower | Loan Amount |
|---|---|---|---|
| Previous Owner | Martinez Oswaldo | $112,917 |
Source: Public Records
Tax History Compared to Growth
Tax History
| Year | Tax Paid | Tax Assessment Tax Assessment Total Assessment is a certain percentage of the fair market value that is determined by local assessors to be the total taxable value of land and additions on the property. | Land | Improvement |
|---|---|---|---|---|
| 2024 | $1,947 | $43,300 | $10,400 | $32,900 |
| 2023 | $1,947 | $43,300 | $10,400 | $32,900 |
| 2022 | $1,902 | $43,300 | $10,400 | $32,900 |
| 2021 | $1,786 | $36,370 | $8,650 | $27,720 |
| 2020 | $1,638 | $36,370 | $8,650 | $27,720 |
| 2019 | $1,652 | $33,850 | $8,650 | $25,200 |
| 2018 | $1,521 | $33,850 | $8,650 | $25,200 |
| 2017 | $1,522 | $33,850 | $8,650 | $25,200 |
| 2016 | $1,528 | $33,850 | $8,650 | $25,200 |
| 2015 | $1,482 | $33,320 | $8,750 | $24,570 |
| 2014 | $1,474 | $33,320 | $8,750 | $24,570 |
| 2013 | $1,635 | $33,320 | $8,750 | $24,570 |
Source: Public Records
Map
Nearby Homes
- 907 Country View Dr
- 752 N Dix St
- Tract 2 - 0000 Ohio 111
- 0000 Ohio 111
- 215 N Dewitt St
- 614 W Jackson St
- 720 W Perry St
- 606 Lincoln Ave
- 418 E Baldwin St
- 717 W Harrison St
- 720 W Wayne St
- 1045 Emerald Rd
- 1051 Emerald Rd
- 1065 Emerald Rd
- 13120 Helen St
- 300 S Williams St
- 825 Johnson Rd
- 13678 Nancy St
- 0 Road 111
- 13688 Kay St
- 617 W Gasser Rd
- 815 Country View Dr
- 903 Country View Dr
- 605 W Gasser Rd
- 811 Country View Dr
- 807 Country View Dr
- 621 W Gasser Rd
- 809 Country View Dr
- 911 Country View Dr
- 800 Country Side Dr
- 819 Springdale Dr
- 810 Country View Dr
- 629 W Gasser Rd
- 915 Country View Dr
- 819 Meadowbrook Dr
- 808 Country View Dr
- 816 Springdale Dr
- 815 Springdale Dr
- 820 Meadowbrook Dr
- 817 Meadowbrook Dr