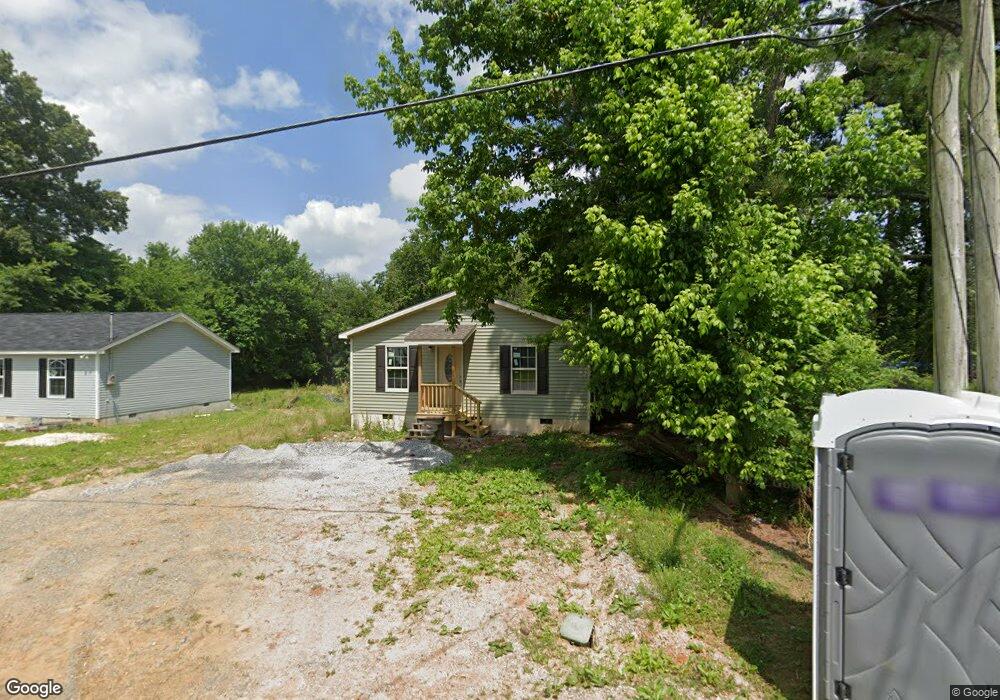
611 Woodrow St Manchester, TN 37355
Estimated Value: $180,000 - $220,000
--
Bed
--
Bath
1,120
Sq Ft
$186/Sq Ft
Est. Value
About This Home
This home is located at 611 Woodrow St, Manchester, TN 37355 and is currently estimated at $208,296, approximately $185 per square foot. 611 Woodrow St is a home located in Coffee County with nearby schools including Westwood Middle School and Temple Baptist Christian School.
Ownership History
Date
Name
Owned For
Owner Type
Purchase Details
Closed on
Aug 4, 2022
Sold by
Southern Custom Building Llc
Bought by
Floyd Glenda and Floyd Larry
Current Estimated Value
Home Financials for this Owner
Home Financials are based on the most recent Mortgage that was taken out on this home.
Original Mortgage
$188,248
Outstanding Balance
$180,395
Interest Rate
5.81%
Mortgage Type
New Conventional
Estimated Equity
$27,901
Purchase Details
Closed on
Apr 24, 2009
Sold by
Reynolds Kevin
Bought by
Southern Custom Building Llc
Purchase Details
Closed on
Oct 21, 2008
Sold by
Reynolds Frankie
Bought by
Reynolds Kevin
Create a Home Valuation Report for This Property
The Home Valuation Report is an in-depth analysis detailing your home's value as well as a comparison with similar homes in the area
Home Values in the Area
Average Home Value in this Area
Purchase History
| Date | Buyer | Sale Price | Title Company |
|---|---|---|---|
| Floyd Glenda | $185,000 | Shawn C Trail Attorney Pc | |
| Southern Custom Building Llc | $10,000 | -- | |
| Reynolds Kevin | -- | -- |
Source: Public Records
Mortgage History
| Date | Status | Borrower | Loan Amount |
|---|---|---|---|
| Open | Floyd Glenda | $188,248 |
Source: Public Records
Tax History Compared to Growth
Tax History
| Year | Tax Paid | Tax Assessment Tax Assessment Total Assessment is a certain percentage of the fair market value that is determined by local assessors to be the total taxable value of land and additions on the property. | Land | Improvement |
|---|---|---|---|---|
| 2024 | $1,440 | $34,150 | $1,800 | $32,350 |
| 2023 | $1,440 | $34,150 | $0 | $0 |
| 2022 | $553 | $15,250 | $1,800 | $13,450 |
| 2021 | $69 | $1,500 | $1,500 | $0 |
| 2020 | $90 | $1,500 | $1,500 | $0 |
| 2019 | $112 | $2,450 | $1,500 | $950 |
| 2018 | $112 | $2,450 | $1,500 | $950 |
| 2017 | $135 | $2,575 | $1,500 | $1,075 |
| 2016 | $135 | $2,575 | $1,500 | $1,075 |
| 2015 | $135 | $2,575 | $1,500 | $1,075 |
| 2014 | $135 | $2,567 | $0 | $0 |
Source: Public Records
Map
Nearby Homes