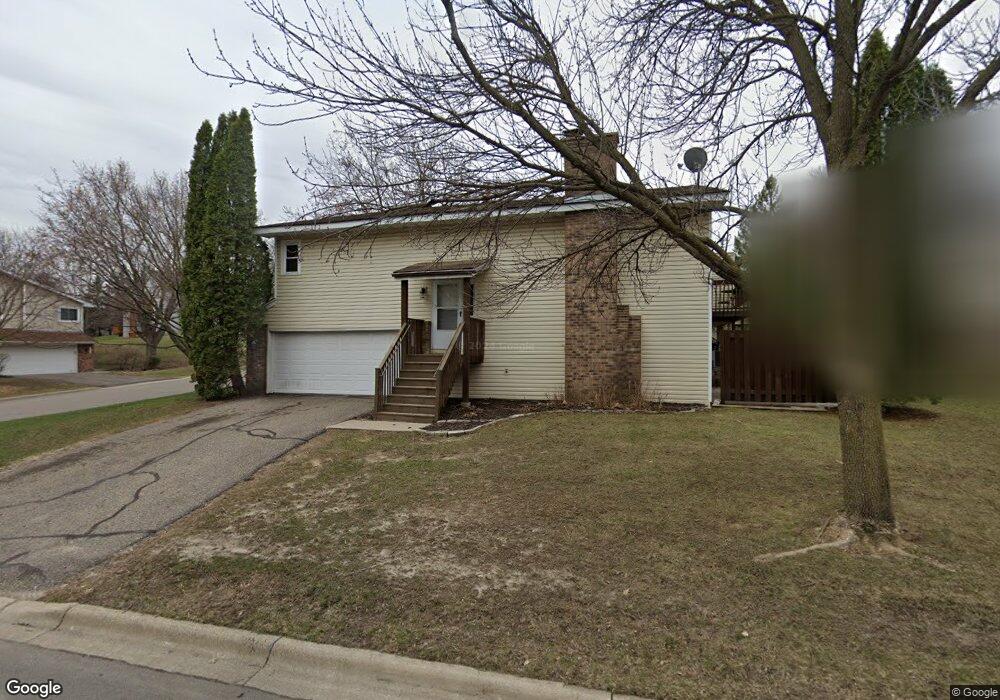
6110 Creek View Ridge Minnetonka, MN 55345
Estimated Value: $300,000 - $330,000
3
Beds
2
Baths
1,020
Sq Ft
$307/Sq Ft
Est. Value
About This Home
This home is located at 6110 Creek View Ridge, Minnetonka, MN 55345 and is currently estimated at $312,907, approximately $306 per square foot. 6110 Creek View Ridge is a home located in Hennepin County with nearby schools including Clear Springs Elementary School, Minnetonka West Middle School, and Minnetonka Senior High School.
Ownership History
Date
Name
Owned For
Owner Type
Purchase Details
Closed on
Apr 24, 2013
Sold by
Smith Ellison and Smith Emily
Bought by
Smith Ellison
Current Estimated Value
Home Financials for this Owner
Home Financials are based on the most recent Mortgage that was taken out on this home.
Original Mortgage
$187,000
Outstanding Balance
$131,457
Interest Rate
3.38%
Mortgage Type
New Conventional
Estimated Equity
$181,450
Purchase Details
Closed on
Jan 18, 2007
Sold by
Mcentyre Michelle M and Olson Michelle M
Bought by
Smith Emily and Smith Ellison
Purchase Details
Closed on
Apr 25, 1997
Sold by
Lundberg John E and Lundberg Inez E
Bought by
Olson Michelle M and Mcentyre Roy E
Create a Home Valuation Report for This Property
The Home Valuation Report is an in-depth analysis detailing your home's value as well as a comparison with similar homes in the area
Home Values in the Area
Average Home Value in this Area
Purchase History
| Date | Buyer | Sale Price | Title Company |
|---|---|---|---|
| Smith Ellison | -- | None Available | |
| Smith Emily | $197,750 | -- | |
| Olson Michelle M | $99,000 | -- |
Source: Public Records
Mortgage History
| Date | Status | Borrower | Loan Amount |
|---|---|---|---|
| Open | Smith Ellison | $187,000 |
Source: Public Records
Tax History Compared to Growth
Tax History
| Year | Tax Paid | Tax Assessment Tax Assessment Total Assessment is a certain percentage of the fair market value that is determined by local assessors to be the total taxable value of land and additions on the property. | Land | Improvement |
|---|---|---|---|---|
| 2024 | $4,148 | $314,400 | $55,500 | $258,900 |
| 2023 | $3,722 | $297,500 | $55,500 | $242,000 |
| 2022 | $3,640 | $288,500 | $55,500 | $233,000 |
| 2021 | $3,286 | $252,900 | $50,000 | $202,900 |
| 2020 | $3,298 | $239,000 | $50,000 | $189,000 |
| 2019 | $3,114 | $229,700 | $50,000 | $179,700 |
| 2018 | $3,076 | $228,500 | $55,000 | $173,500 |
| 2017 | $2,621 | $194,700 | $50,000 | $144,700 |
| 2016 | $2,237 | $169,800 | $50,000 | $119,800 |
| 2015 | $2,042 | $157,000 | $40,000 | $117,000 |
| 2014 | -- | $155,500 | $40,000 | $115,500 |
Source: Public Records
Map
Nearby Homes
- 18502 Apple Tree Ct
- 18130 Covington Path
- 5980 Covington Terrace
- 5826 Salisbury Ave
- 18863 Broadmoore Dr
- 19500 Silver Lake Trail
- 5534 Conifer Trail
- 6281 Whispering Oaks Dr
- 6285 Duck Lake Rd
- 450 Indian Hill Rd
- 460 Indian Hill Rd
- 17110 Claycross Way
- 6015 Ridge Rd
- 6620 Horseshoe Curve
- 5800 Scenic Heights Dr
- 6060 Ridge Rd
- 19767 Waterford Ct
- 19139 Maple Leaf Dr
- 16816 Excelsior Blvd
- 17238 Millwood Rd
- 6120 Creek View Ridge
- 6108 Creek View Trail
- 6130 Creek View Ridge
- 6106 Creek View Trail
- 6119 Creek View Trail
- 6117 Creek View Trail
- 6111 Creek View Ridge
- 6115 Creek View Trail
- 6121 Creek View Ridge
- 6121 Creek View Trail
- 6111 Creek View Trail
- 6102 Creek View Trail
- 6140 Creek View Ridge
- 6123 Creek View Trail
- 6109 Creek View Trail
- 6131 Creek View Ridge
- 6107 Creek View Trail
- 6150 Creek View Ridge
- 6130 Creek View Trail
- 6125 Creek View Trail