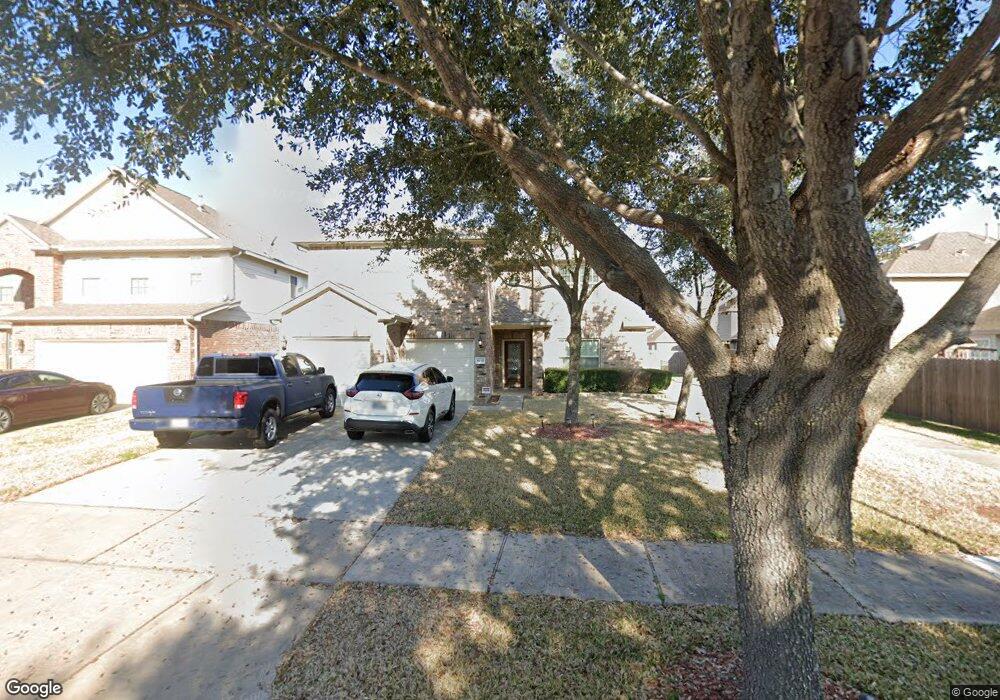
6110 Oxford Lake Dr Rosenberg, TX 77471
Estimated Value: $349,000 - $382,000
4
Beds
3
Baths
3,075
Sq Ft
$118/Sq Ft
Est. Value
About This Home
This home is located at 6110 Oxford Lake Dr, Rosenberg, TX 77471 and is currently estimated at $363,852, approximately $118 per square foot. 6110 Oxford Lake Dr is a home located in Fort Bend County with nearby schools including Jackson Elementary School, Henry Wertheimer Middle School, and Briscoe Junior High School.
Ownership History
Date
Name
Owned For
Owner Type
Purchase Details
Closed on
Aug 3, 2015
Sold by
Edison John and Edison Elizabeth
Bought by
Tristan Escobedo Lisa and Escobedo Tomas
Current Estimated Value
Home Financials for this Owner
Home Financials are based on the most recent Mortgage that was taken out on this home.
Original Mortgage
$207,100
Outstanding Balance
$163,104
Interest Rate
4.07%
Mortgage Type
New Conventional
Estimated Equity
$200,748
Purchase Details
Closed on
Mar 11, 2011
Sold by
Identity Kingdom Heights Lp
Bought by
Edison John and Edison Elizabeth
Home Financials for this Owner
Home Financials are based on the most recent Mortgage that was taken out on this home.
Original Mortgage
$196,828
Interest Rate
5.25%
Mortgage Type
FHA
Purchase Details
Closed on
Dec 7, 2010
Sold by
Basin Development Company Lp
Bought by
Tristan-Escobedo Lisa and Tristan-Escobedo Tomas
Create a Home Valuation Report for This Property
The Home Valuation Report is an in-depth analysis detailing your home's value as well as a comparison with similar homes in the area
Home Values in the Area
Average Home Value in this Area
Purchase History
| Date | Buyer | Sale Price | Title Company |
|---|---|---|---|
| Tristan Escobedo Lisa | -- | Attorney | |
| Edison John | -- | Stewart Title Richmond | |
| Tristan-Escobedo Lisa | -- | -- | |
| Tristan-Escobedo Lisa | -- | -- |
Source: Public Records
Mortgage History
| Date | Status | Borrower | Loan Amount |
|---|---|---|---|
| Open | Tristan Escobedo Lisa | $207,100 | |
| Previous Owner | Tristan-Escobedo Lisa | $196,828 |
Source: Public Records
Tax History Compared to Growth
Tax History
| Year | Tax Paid | Tax Assessment Tax Assessment Total Assessment is a certain percentage of the fair market value that is determined by local assessors to be the total taxable value of land and additions on the property. | Land | Improvement |
|---|---|---|---|---|
| 2025 | $6,876 | $347,900 | $51,597 | $296,303 |
| 2024 | $6,876 | $317,819 | $586 | $317,233 |
| 2023 | $6,234 | $288,926 | $0 | $328,467 |
| 2022 | $6,603 | $262,660 | $0 | $295,460 |
| 2021 | $6,673 | $238,780 | $39,690 | $199,090 |
| 2020 | $6,704 | $237,530 | $39,690 | $197,840 |
| 2019 | $7,088 | $239,940 | $39,690 | $200,250 |
| 2018 | $6,945 | $234,690 | $37,800 | $196,890 |
| 2017 | $6,324 | $213,350 | $37,800 | $175,550 |
| 2016 | $6,586 | $222,200 | $37,800 | $184,400 |
| 2015 | $4,095 | $218,290 | $37,800 | $180,490 |
| 2014 | $3,581 | $189,990 | $37,800 | $152,190 |
Source: Public Records
Map
Nearby Homes
- 6015 Biltmore
- 2202 Winchester Lake
- 2019 Preston Park
- 5815 Watford Bend
- 6018 Wickshire Dr
- 6111 Wickshire Dr
- 6135 Carnaby Ln
- 5914 Prince Place Dr
- Tuscaloosa Plan at Kingdom Heights
- Tacoma Plan at Kingdom Heights
- 5539 Bowquiver Ln
- Davenport Plan at Kingdom Heights
- 5515 Handlewood Ln
- Pasadena ESP Plan at Kingdom Heights
- El Paso Plan at Kingdom Heights
- 2618 Clapbread Ln
- Boise Plan at Kingdom Heights
- 5814 Wayne Way
- The Oleander (L401) Plan at Kingdom Heights
- The Royal (L481) Plan at Kingdom Heights
- 6114 Oxford Lake Dr
- 2207 Wembley Way
- 6118 Oxford Lake Dr
- 2211 Wembley Way
- 2203 Wembley Way
- 6122 Oxford Lake Dr
- 6111 Oxford Lake Dr
- 2215 Wembley Way
- 6115 Oxford Lake Dr
- 2119 Wembley Way
- 6119 Oxford Lake Dr
- 6126 Oxford Lake Dr
- 2219 Wembley Way
- 2115 Wembley Way
- 2202 Wembley Way
- 6123 Oxford Lake Dr
- 2206 Wembley Way
- 2210 Wembley Way
- 6127 Oxford Lake Dr
- 2111 Wembley Way