Estimated Value: $719,000 - $772,000
3
Beds
2
Baths
1,345
Sq Ft
$557/Sq Ft
Est. Value
About This Home
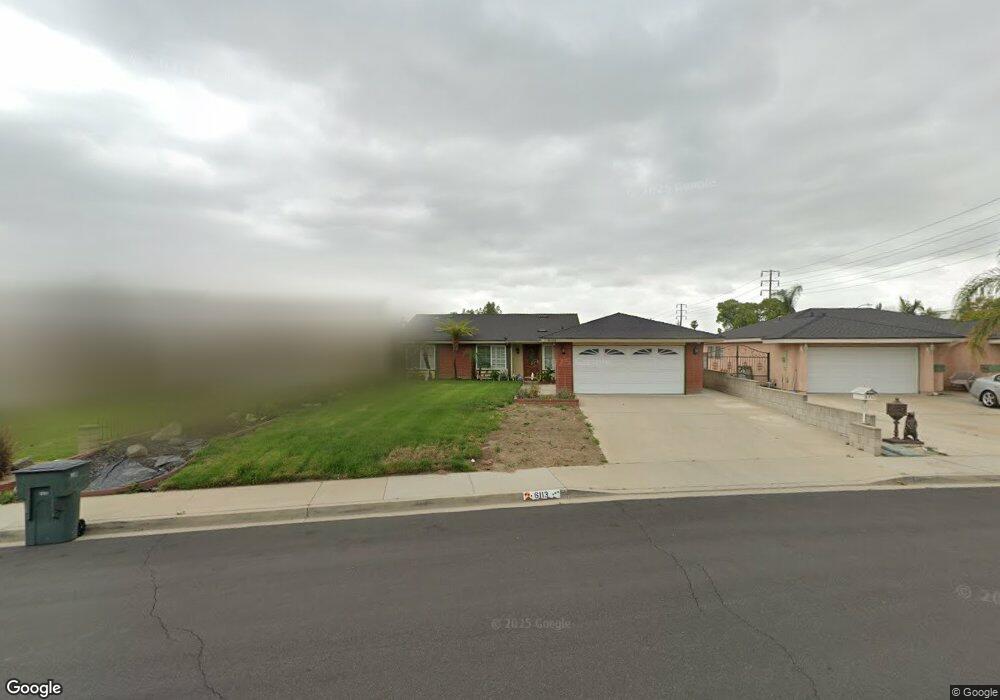
This home is located at 6113 Grant St, Chino, CA 91710 and is currently estimated at $749,784, approximately $557 per square foot. 6113 Grant St is a home located in San Bernardino County with nearby schools including Alicia Cortez Elementary, Magnolia Junior High, and Chino High School.
Ownership History
Date
Name
Owned For
Owner Type
Purchase Details
Closed on
Nov 7, 2005
Sold by
Meza Carmen M
Bought by
Meza Felix
Current Estimated Value
Purchase Details
Closed on
Jan 5, 2005
Sold by
Meza Felix
Bought by
Meza Felix and Meza Carmen M
Purchase Details
Closed on
Jul 14, 2004
Sold by
Harr Robert E
Bought by
Meza Felix
Home Financials for this Owner
Home Financials are based on the most recent Mortgage that was taken out on this home.
Original Mortgage
$290,000
Interest Rate
2.37%
Mortgage Type
Purchase Money Mortgage
Purchase Details
Closed on
Aug 21, 2002
Sold by
Bouwman Albert Y
Bought by
Bouwman Linda
Home Financials for this Owner
Home Financials are based on the most recent Mortgage that was taken out on this home.
Original Mortgage
$184,000
Interest Rate
6.52%
Purchase Details
Closed on
Jul 5, 2002
Sold by
Bouwman Linda
Bought by
Harr Robert E
Home Financials for this Owner
Home Financials are based on the most recent Mortgage that was taken out on this home.
Original Mortgage
$184,000
Interest Rate
6.52%
Purchase Details
Closed on
Jun 11, 1998
Sold by
Vanhofwegen James R and Vanhofwegen Van Hofwegen
Bought by
Haagsma Linda and Vanhofwegen Linda
Create a Home Valuation Report for This Property
The Home Valuation Report is an in-depth analysis detailing your home's value as well as a comparison with similar homes in the area
Home Values in the Area
Average Home Value in this Area
Purchase History
| Date | Buyer | Sale Price | Title Company |
|---|---|---|---|
| Meza Felix | -- | -- | |
| Meza Felix | -- | -- | |
| Meza Felix | $390,000 | First American | |
| Bouwman Linda | -- | New Century Title Company | |
| Harr Robert E | -- | New Century Title Company | |
| Haagsma Linda | -- | -- |
Source: Public Records
Mortgage History
| Date | Status | Borrower | Loan Amount |
|---|---|---|---|
| Previous Owner | Meza Felix | $290,000 | |
| Previous Owner | Harr Robert E | $184,000 |
Source: Public Records
Tax History
| Year | Tax Paid | Tax Assessment Tax Assessment Total Assessment is a certain percentage of the fair market value that is determined by local assessors to be the total taxable value of land and additions on the property. | Land | Improvement |
|---|---|---|---|---|
| 2025 | $5,983 | $543,629 | $190,270 | $353,359 |
| 2024 | $5,822 | $532,969 | $186,539 | $346,430 |
| 2023 | $5,659 | $522,518 | $182,881 | $339,637 |
| 2022 | $5,624 | $512,272 | $179,295 | $332,977 |
| 2021 | $5,513 | $502,227 | $175,779 | $326,448 |
| 2020 | $5,441 | $497,078 | $173,977 | $323,101 |
| 2019 | $5,344 | $487,332 | $170,566 | $316,766 |
| 2018 | $5,225 | $477,777 | $167,222 | $310,555 |
| 2017 | $4,914 | $448,800 | $156,600 | $292,200 |
| 2016 | $4,457 | $427,400 | $149,100 | $278,300 |
| 2015 | $4,220 | $407,000 | $142,000 | $265,000 |
| 2014 | $3,873 | $374,000 | $131,000 | $243,000 |
Source: Public Records
Map
Nearby Homes
- 12524 Ross Ave
- 12644 Oaks Ave
- 12321 Gardenia Place
- 12446 Chestnut Place
- 5925 Riverside Dr Unit 12
- 12775 16th St
- 2321 S Magnolia Ave Unit 6D
- 12346 Cedar Ave
- 6659 Grant St
- 12997 Falcon Place
- 6681 Eisenhower Ct
- 1106 W Philadelphia St
- 6677 Fillmore St
- 926 W Philadelphia St Unit 41
- 926 W Philadelphia St Unit Q93
- 926 W Philadelphia St Unit 57
- 12836 12th St Unit 27
- 12836 12th St Unit 73
- 5945 Olvera Ct
- 6755 Foxcroft Ct
- 6125 Grant St
- 6101 Grant St
- 6114 Pierce St
- 6126 Pierce St
- 6102 Pierce St
- 12634 Birch Ave
- 12646 Birch Ave
- 12613 Magnolia Ave
- 12622 Birch Ave
- 12658 Birch Ave
- 12660 Birch Ave
- 6126 Grant St
- 12644 Magnolia Ave
- 12636 Magnolia Ave
- 6138 Grant St
- 12601 Magnolia Ave
- 12626 Magnolia Ave
- 12666 Magnolia Ave
- 6140 Grant St
- 12614 Magnolia Ave
Your Personal Tour Guide
Ask me questions while you tour the home.