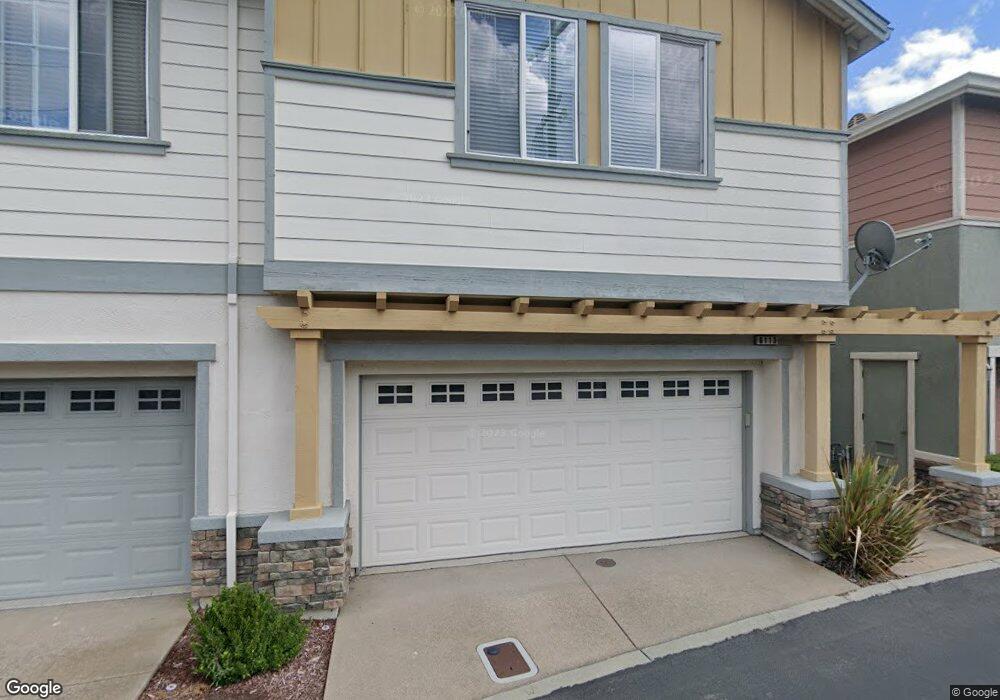
6113 Moore Place Dublin, CA 94568
Estimated Value: $833,000 - $1,208,000
3
Beds
3
Baths
1,396
Sq Ft
$676/Sq Ft
Est. Value
About This Home
This home is located at 6113 Moore Place, Dublin, CA 94568 and is currently estimated at $944,315, approximately $676 per square foot. 6113 Moore Place is a home located in Alameda County with nearby schools including Murray Elementary School, Wells Middle School, and Dublin High School.
Ownership History
Date
Name
Owned For
Owner Type
Purchase Details
Closed on
May 6, 2025
Sold by
Mann Timmy and Mann Sirintorn
Bought by
Mann Family Trust and Mann
Current Estimated Value
Purchase Details
Closed on
May 23, 2008
Sold by
Mann Timmy
Bought by
Mann Timmy and Mann Sirintorn
Home Financials for this Owner
Home Financials are based on the most recent Mortgage that was taken out on this home.
Original Mortgage
$297,000
Interest Rate
5.37%
Mortgage Type
Purchase Money Mortgage
Purchase Details
Closed on
Dec 16, 2002
Sold by
Scarlett Homes Llc
Bought by
Mann Timmy
Home Financials for this Owner
Home Financials are based on the most recent Mortgage that was taken out on this home.
Original Mortgage
$331,887
Interest Rate
5.5%
Create a Home Valuation Report for This Property
The Home Valuation Report is an in-depth analysis detailing your home's value as well as a comparison with similar homes in the area
Purchase History
| Date | Buyer | Sale Price | Title Company |
|---|---|---|---|
| Mann Family Trust | -- | None Listed On Document | |
| Mann Timmy | $148,500 | None Available | |
| Mann Timmy | $415,000 | First American Title Guarant |
Source: Public Records
Mortgage History
| Date | Status | Borrower | Loan Amount |
|---|---|---|---|
| Previous Owner | Mann Timmy | $297,000 | |
| Previous Owner | Mann Timmy | $331,887 | |
| Closed | Mann Timmy | $41,000 |
Source: Public Records
Tax History
| Year | Tax Paid | Tax Assessment Tax Assessment Total Assessment is a certain percentage of the fair market value that is determined by local assessors to be the total taxable value of land and additions on the property. | Land | Improvement |
|---|---|---|---|---|
| 2025 | $8,562 | $600,712 | $180,300 | $420,412 |
| 2024 | $8,562 | $588,936 | $176,766 | $412,170 |
| 2023 | $8,467 | $577,392 | $173,301 | $404,091 |
| 2022 | $8,359 | $566,072 | $169,903 | $396,169 |
| 2021 | $8,274 | $554,976 | $166,573 | $388,403 |
| 2020 | $7,752 | $549,289 | $164,866 | $384,423 |
| 2019 | $7,708 | $538,521 | $161,634 | $376,887 |
| 2018 | $7,511 | $527,965 | $158,466 | $369,499 |
| 2017 | $7,398 | $517,615 | $155,359 | $362,256 |
| 2016 | $6,761 | $507,469 | $152,314 | $355,155 |
| 2015 | $6,528 | $499,850 | $150,027 | $349,823 |
| 2014 | $6,411 | $480,000 | $144,000 | $336,000 |
Source: Public Records
Map
Nearby Homes
- 6210 Strawberry Way
- 6210 Strawberry Way Unit 83
- Residence 3X Plan at Abbey Neighborhood at Boulevard - Abbey Neighborhood
- Residence 2X Plan at Abbey Neighborhood at Boulevard - Abbey Neighborhood
- 6357 Dandelion St
- 6382 Dove Ave
- 6468 Rosebay Ct
- 6123 Sandpiper Rd
- 5860 Silhouette Ct
- 5882 Beechwood Loop
- 6759 S Mariposa Ln
- 5501 De Marcus Blvd Unit 542
- 5501 De Marcus Blvd Unit 206
- 5501 De Marcus Blvd Unit 328
- 5501 De Marcus Blvd Unit 564
- 5626 El Dorado Ln
- 5630 Central Pkwy Unit 202
- 5728 Kemper Place Unit 401
- 5636 Fallbrook Ct
- 6056 Bullion Ln
- 6119 Moore Place
- 6107 Moore Place
- 6125 Moore Place
- 6101 Moore Place
- 6131 Moore Place
- 6137 Moore Place
- 6143 Moore Place
- 6149 Moore Place
- 6155 Moore Place
- 6163 Moore Place
- 6167 Moore Place
- 1429 Moore Place
- 6174 Moore Place
- 6180 Moore Place
- 6186 Moore Place
- 6192 Moore Place
- 6294 Kerry Ct
- 6298 Kerry Ct
- 6288 Sussex Dr
- 6282 Kerry Ct
Your Personal Tour Guide
Ask me questions while you tour the home.