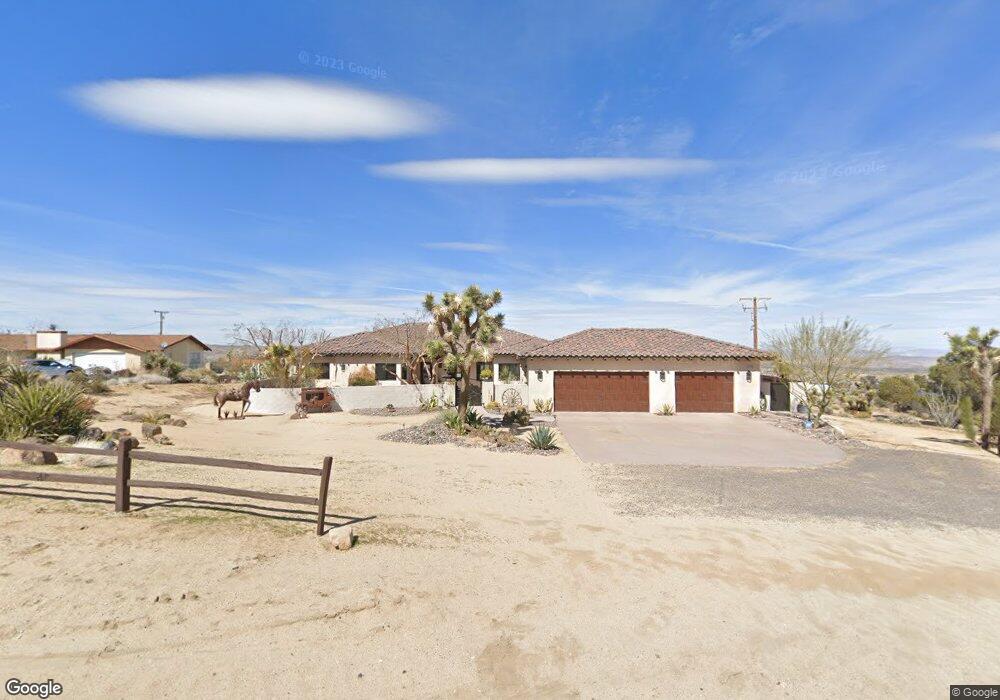
61138 Onaga Trail Joshua Tree, CA 92252
Estimated Value: $784,326 - $1,015,000
3
Beds
2
Baths
2,561
Sq Ft
$359/Sq Ft
Est. Value
About This Home
This home is located at 61138 Onaga Trail, Joshua Tree, CA 92252 and is currently estimated at $918,832, approximately $358 per square foot. 61138 Onaga Trail is a home located in San Bernardino County with nearby schools including Friendly Hills Elementary School, La Contenta Middle School, and Yucca Valley High School.
Ownership History
Date
Name
Owned For
Owner Type
Purchase Details
Closed on
Aug 27, 2010
Sold by
Guindon Marjorie
Bought by
Rauschenberg Monte D and Rauschenberg Robbi L
Current Estimated Value
Purchase Details
Closed on
May 19, 2008
Sold by
Gill Abigail
Bought by
Guindon Marjorie
Purchase Details
Closed on
Jan 11, 2005
Sold by
Adams Marlene S
Bought by
Gill Abigail
Purchase Details
Closed on
Aug 5, 1994
Sold by
Benson Melvin A
Bought by
Adams Donald J and Adams Marlene S
Home Financials for this Owner
Home Financials are based on the most recent Mortgage that was taken out on this home.
Original Mortgage
$15,000
Interest Rate
8.65%
Mortgage Type
Seller Take Back
Create a Home Valuation Report for This Property
The Home Valuation Report is an in-depth analysis detailing your home's value as well as a comparison with similar homes in the area
Home Values in the Area
Average Home Value in this Area
Purchase History
| Date | Buyer | Sale Price | Title Company |
|---|---|---|---|
| Rauschenberg Monte D | $20,000 | Fidelity National Title Co | |
| Guindon Marjorie | $59,454 | Spl Title Services | |
| Gill Abigail | $53,500 | Fidelity National Title Co | |
| Adams Donald J | $17,500 | First American Title Company |
Source: Public Records
Mortgage History
| Date | Status | Borrower | Loan Amount |
|---|---|---|---|
| Previous Owner | Adams Donald J | $15,000 |
Source: Public Records
Tax History Compared to Growth
Tax History
| Year | Tax Paid | Tax Assessment Tax Assessment Total Assessment is a certain percentage of the fair market value that is determined by local assessors to be the total taxable value of land and additions on the property. | Land | Improvement |
|---|---|---|---|---|
| 2025 | $5,231 | $447,584 | $32,029 | $415,555 |
| 2024 | $5,231 | $438,808 | $31,401 | $407,407 |
| 2023 | $5,131 | $430,204 | $30,785 | $399,419 |
| 2022 | $5,027 | $421,768 | $30,181 | $391,587 |
| 2021 | $4,973 | $413,498 | $29,589 | $383,909 |
| 2020 | $4,935 | $409,258 | $29,286 | $379,972 |
| 2019 | $5,220 | $401,234 | $28,712 | $372,522 |
| 2018 | $5,004 | $393,367 | $28,149 | $365,218 |
| 2017 | $4,953 | $385,654 | $27,597 | $358,057 |
| 2016 | $4,867 | $378,092 | $27,056 | $351,036 |
| 2015 | $4,762 | $372,413 | $26,650 | $345,763 |
| 2014 | $4,770 | $365,118 | $26,128 | $338,990 |
Source: Public Records
Map
Nearby Homes
- 7564 Vista Rd
- 61029 Navajo Trail
- 60985 Navajo Trail
- 61185 Sandalwood Trail
- 61073 Sandalwood Trail
- 0 Onaga Trail Unit IV25023327
- 0 Onaga Trail Unit 25530237
- 60976 Sandalwood Trail
- 61246 Melton Trail
- 61118 Prescott Trail
- 61100 Sandalwood Trail
- 0 Sunny Vista Rd Unit OC25211292
- 0 Sunny Vista Rd Unit OC25211218
- 0 Sunny Vista Rd Unit 25464087
- 61475 Onaga Trail
- 7677 Wilton Rd
- 0 Latham Trail Unit 219133231DA
- 61413 Sandalwood Trail
- 61375 Latham Trail
- 7284 Saddleback Rd
- 61116 Onaga Trail
- 61166 Onaga Trail
- 61119 Melton Trail
- 61165 Melton Trail
- 61184 Onaga Trail
- 61115 Onaga Trail
- 61102 Onaga Trail
- 61206 Onaga Trail
- 7654 Vista Rd
- 7542 Vista Rd
- 7614 Vista Rd
- 61134 Navajo Trail
- 61118 Navajo Trail
- 61148 Navajo Trail
- 0 Vista Rd
- 61104 Navajo Trail
- 61164 Navajo Trail
- 61225 Melton Trail
- 61090 Navajo Trail
- 61076 Navajo Trail