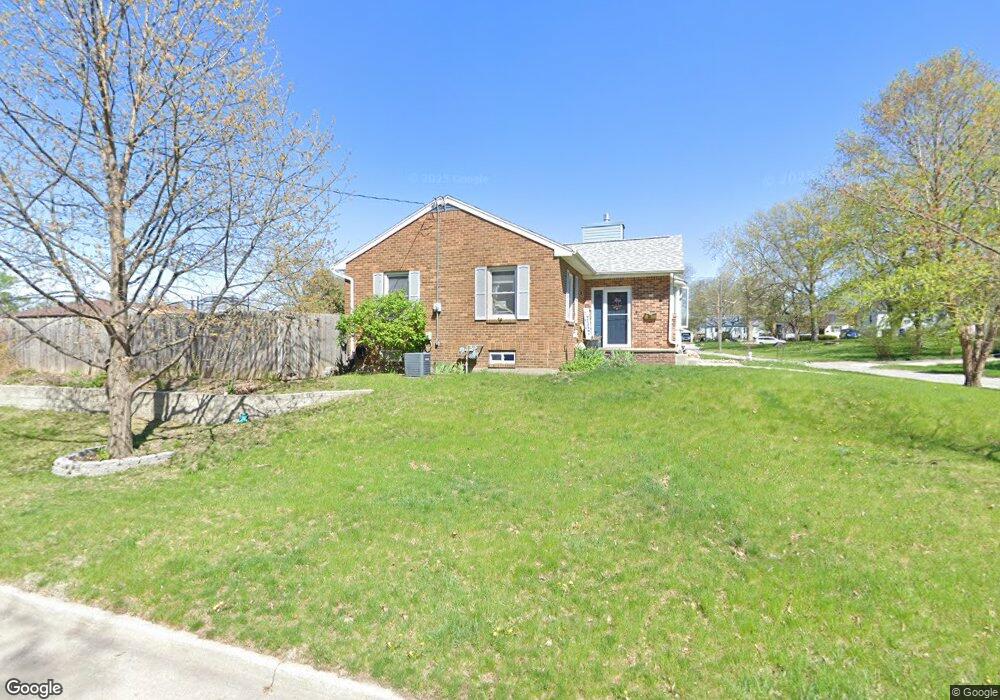
6115 Francis Ave Des Moines, IA 50322
Merle Hay NeighborhoodEstimated Value: $221,000 - $233,000
2
Beds
1
Bath
932
Sq Ft
$244/Sq Ft
Est. Value
About This Home
This home is located at 6115 Francis Ave, Des Moines, IA 50322 and is currently estimated at $226,998, approximately $243 per square foot. 6115 Francis Ave is a home located in Polk County with nearby schools including Hillis Elementary School, Merrill Middle School, and Roosevelt High School.
Ownership History
Date
Name
Owned For
Owner Type
Purchase Details
Closed on
Dec 8, 1998
Sold by
The Pacesetter Corp
Bought by
Neufeld Steven and Neufeld Cheryl D
Current Estimated Value
Home Financials for this Owner
Home Financials are based on the most recent Mortgage that was taken out on this home.
Original Mortgage
$10,852
Interest Rate
11%
Mortgage Type
Seller Take Back
Create a Home Valuation Report for This Property
The Home Valuation Report is an in-depth analysis detailing your home's value as well as a comparison with similar homes in the area
Home Values in the Area
Average Home Value in this Area
Purchase History
| Date | Buyer | Sale Price | Title Company |
|---|---|---|---|
| Neufeld Steven | $15,854 | -- |
Source: Public Records
Mortgage History
| Date | Status | Borrower | Loan Amount |
|---|---|---|---|
| Closed | Neufeld Steven | $10,852 |
Source: Public Records
Tax History Compared to Growth
Tax History
| Year | Tax Paid | Tax Assessment Tax Assessment Total Assessment is a certain percentage of the fair market value that is determined by local assessors to be the total taxable value of land and additions on the property. | Land | Improvement |
|---|---|---|---|---|
| 2025 | $3,648 | $236,400 | $45,600 | $190,800 |
| 2024 | $3,648 | $211,500 | $40,100 | $171,400 |
| 2023 | $4,096 | $211,500 | $40,100 | $171,400 |
| 2022 | $4,096 | $186,100 | $36,200 | $149,900 |
| 2021 | $4,064 | $186,100 | $36,200 | $149,900 |
| 2020 | $4,012 | $166,900 | $32,300 | $134,600 |
| 2019 | $3,664 | $166,900 | $32,300 | $134,600 |
| 2018 | $3,620 | $148,100 | $28,200 | $119,900 |
| 2017 | $3,230 | $148,100 | $28,200 | $119,900 |
| 2016 | $3,140 | $131,200 | $24,600 | $106,600 |
| 2015 | $3,140 | $131,200 | $24,600 | $106,600 |
| 2014 | $2,994 | $124,700 | $22,000 | $102,700 |
Source: Public Records
Map
Nearby Homes
- 2325 61st St
- 2002 60th St
- 1917 59th St
- 5722 Lincoln Ave
- 2621 60th St
- 2615 59th St
- 2610 Westover Blvd
- 1617 61st St
- 1617 60th St
- 1704 Merle Hay Rd
- 6700 Sheridan Ave
- 6120 College Ave
- 2729 67th St
- 6808 Timmons Dr
- 1822 55th St
- 5616 New York Ave
- 5820 Urbandale Ave
- 2708 68th St
- 5521 Sheridan Ave
- 1517 61st St