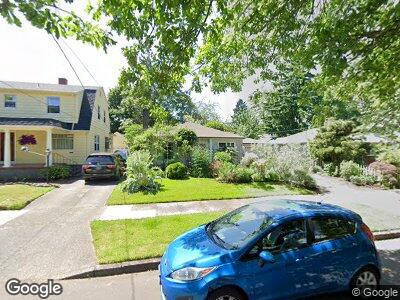
6115 N Wilbur Ave Portland, OR 97217
Arbor Lodge NeighborhoodEstimated Value: $396,000 - $431,000
2
Beds
1
Bath
784
Sq Ft
$532/Sq Ft
Est. Value
About This Home
This home is located at 6115 N Wilbur Ave, Portland, OR 97217 and is currently estimated at $417,256, approximately $532 per square foot. 6115 N Wilbur Ave is a home located in Multnomah County with nearby schools including Chief Joseph Elementary School, Ockley Green, and Jefferson High School.
Ownership History
Date
Name
Owned For
Owner Type
Purchase Details
Closed on
Jan 18, 2017
Sold by
Belmont Investment Properties Llc
Bought by
Urban Owl Llc
Current Estimated Value
Purchase Details
Closed on
Sep 10, 2012
Sold by
City Of Portland
Bought by
City Of Portland
Purchase Details
Closed on
May 4, 2009
Sold by
Belmont Investment Properties Llc
Bought by
Anand Ann and Ann Anand Revocable Living Trust
Purchase Details
Closed on
Apr 23, 2007
Sold by
Anand Ann L
Bought by
Belmont Investment Properties Llc
Purchase Details
Closed on
Mar 29, 2006
Sold by
Dill Jeffery J
Bought by
Dill Jeffery J and Steingass Dill Annette
Purchase Details
Closed on
Jun 9, 1997
Sold by
Glick Shirley D
Bought by
Glick Ann L
Home Financials for this Owner
Home Financials are based on the most recent Mortgage that was taken out on this home.
Original Mortgage
$72,100
Interest Rate
7.98%
Mortgage Type
Purchase Money Mortgage
Purchase Details
Closed on
Nov 7, 1995
Sold by
Bouneff B B and Wilson James L
Bought by
Scott Ann Grace
Create a Home Valuation Report for This Property
The Home Valuation Report is an in-depth analysis detailing your home's value as well as a comparison with similar homes in the area
Home Values in the Area
Average Home Value in this Area
Purchase History
| Date | Buyer | Sale Price | Title Company |
|---|---|---|---|
| Urban Owl Llc | -- | None Available | |
| Urban Owl Llc | -- | None Available | |
| City Of Portland | -- | None Available | |
| Anand Ann | -- | None Available | |
| Belmont Investment Properties Llc | -- | None Available | |
| Dill Jeffery J | -- | Accommodation | |
| Glick Ann L | $72,500 | Fidelity National Title Co | |
| Scott Ann Grace | $165,000 | Chicago Title | |
| Bouneff B B | -- | Chicago Title |
Source: Public Records
Mortgage History
| Date | Status | Borrower | Loan Amount |
|---|---|---|---|
| Previous Owner | Mayhew John | $14,650 | |
| Previous Owner | Glick Ann L | $72,100 |
Source: Public Records
Tax History Compared to Growth
Tax History
| Year | Tax Paid | Tax Assessment Tax Assessment Total Assessment is a certain percentage of the fair market value that is determined by local assessors to be the total taxable value of land and additions on the property. | Land | Improvement |
|---|---|---|---|---|
| 2023 | $2,824 | $106,590 | $0 | $0 |
| 2022 | $2,763 | $103,490 | $0 | $0 |
| 2021 | $2,717 | $100,480 | $0 | $0 |
| 2020 | $2,492 | $97,560 | $0 | $0 |
| 2019 | $2,401 | $94,720 | $0 | $0 |
| 2018 | $2,330 | $91,970 | $0 | $0 |
| 2017 | $2,234 | $89,300 | $0 | $0 |
| 2016 | $2,044 | $86,700 | $0 | $0 |
| 2015 | $1,991 | $84,180 | $0 | $0 |
| 2014 | $1,961 | $81,730 | $0 | $0 |
Source: Public Records
Map
Nearby Homes
- 6304 N Burrage Ave
- 5805 N Burrage Ave
- 5835 N Boston Ave
- 5819 N Greeley Ave
- 6356 N Omaha Ave
- 2407 N Rosa Parks Way
- 6444 N Omaha Ave
- 1285 N Liberty St
- 3129 N Willamette Blvd Unit 205
- 3129 N Willamette Blvd Unit 207
- 6533 N Atlantic Ave Unit A
- 2955 N Willamette Blvd
- 2104 N Rosa Parks Way
- 6529 N Villard Ave
- 5554 N Boston Ave
- 3107 N Rosa Parks Way
- 6728 N Boston Ave
- 2935 N Willamette Blvd
- 5925 N Campbell Ave
- 1815 N Ainsworth St
- 6115 N Wilbur Ave
- 6127 N Wilbur Ave
- 6125 N Wilbur Ave
- 6105 N Wilbur Ave
- 6114 N Burrage Ave
- 6135 N Wilbur Ave
- 6106 N Burrage Ave
- 6124 N Burrage Ave
- 6036 N Burrage Ave
- 6134 N Burrage Ave
- 6025 N Wilbur Ave
- 6114 N Wilbur Ave
- 6205 N Wilbur Ave
- 6126 N Wilbur Ave
- 6026 N Burrage Ave
- 6204 N Burrage Ave
- 6032 N Wilbur Ave
- 6136 N Wilbur Ave
- 6211 N Wilbur Ave
- 6011 N Wilbur Ave