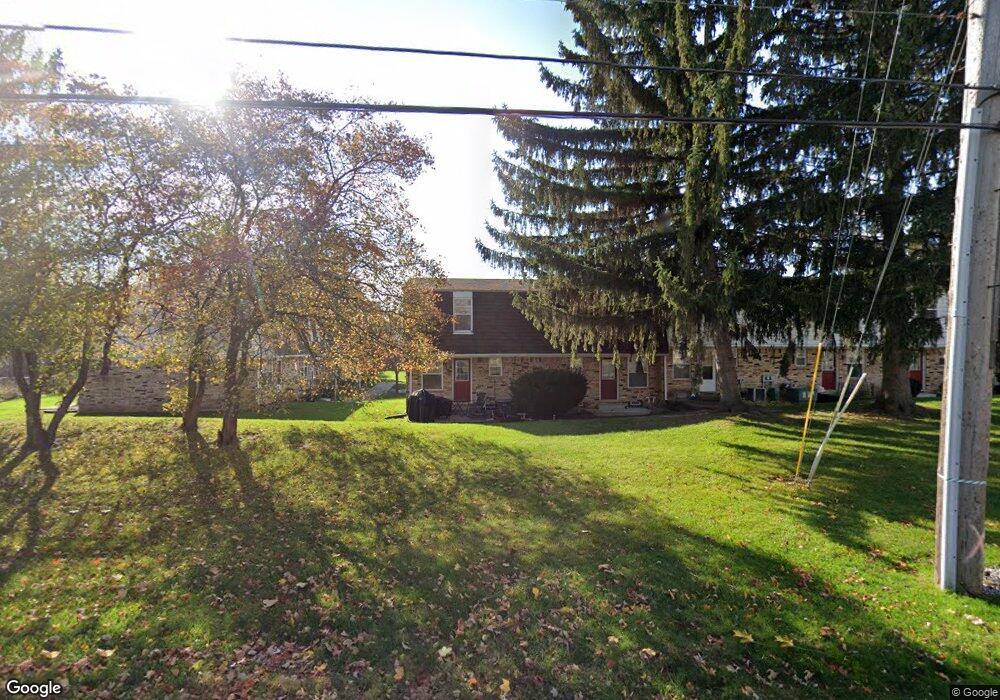
6115 Scotmar Dr Unit 8 Lansing, MI 48911
Southern Lansing NeighborhoodEstimated Value: $108,000 - $110,512
3
Beds
1
Bath
1,072
Sq Ft
$102/Sq Ft
Est. Value
About This Home
This home is located at 6115 Scotmar Dr Unit 8, Lansing, MI 48911 and is currently estimated at $109,128, approximately $101 per square foot. 6115 Scotmar Dr Unit 8 is a home located in Ingham County with nearby schools including Forest View School, Attwood School, and Everett High School.
Ownership History
Date
Name
Owned For
Owner Type
Purchase Details
Closed on
Apr 25, 2008
Sold by
Pines Investment Co
Bought by
Phifer Donna
Current Estimated Value
Home Financials for this Owner
Home Financials are based on the most recent Mortgage that was taken out on this home.
Original Mortgage
$48,000
Interest Rate
5.88%
Mortgage Type
Purchase Money Mortgage
Purchase Details
Closed on
Feb 8, 2007
Sold by
Mccloyn Sharon Kay and Harrison Angela June
Bought by
Pines Investment Co
Purchase Details
Closed on
Dec 16, 2005
Sold by
Miller Park Townhome Condominiums Llc
Bought by
Mccloyn Sharon K and Harrison Angela June
Home Financials for this Owner
Home Financials are based on the most recent Mortgage that was taken out on this home.
Original Mortgage
$96,988
Interest Rate
6.4%
Mortgage Type
Fannie Mae Freddie Mac
Purchase Details
Closed on
Jan 14, 2004
Sold by
Scotmar Townhomes Llc
Bought by
Miller Park Townhome Condominiums Llc
Create a Home Valuation Report for This Property
The Home Valuation Report is an in-depth analysis detailing your home's value as well as a comparison with similar homes in the area
Home Values in the Area
Average Home Value in this Area
Purchase History
| Date | Buyer | Sale Price | Title Company |
|---|---|---|---|
| Phifer Donna | $60,000 | Metropolitan Title Company | |
| Pines Investment Co | $103,814 | None Available | |
| Mccloyn Sharon K | $97,238 | Metropolitan Title Company | |
| Miller Park Townhome Condominiums Llc | -- | Metro |
Source: Public Records
Mortgage History
| Date | Status | Borrower | Loan Amount |
|---|---|---|---|
| Closed | Phifer Donna | $48,000 | |
| Previous Owner | Mccloyn Sharon K | $96,988 |
Source: Public Records
Tax History Compared to Growth
Tax History
| Year | Tax Paid | Tax Assessment Tax Assessment Total Assessment is a certain percentage of the fair market value that is determined by local assessors to be the total taxable value of land and additions on the property. | Land | Improvement |
|---|---|---|---|---|
| 2025 | $2,396 | $42,600 | $3,500 | $39,100 |
| 2024 | $21 | $37,100 | $3,500 | $33,600 |
| 2023 | $2,252 | $32,800 | $3,500 | $29,300 |
| 2022 | $2,049 | $29,300 | $1,300 | $28,000 |
| 2021 | $2,001 | $27,300 | $1,300 | $26,000 |
| 2020 | $1,988 | $26,600 | $1,300 | $25,300 |
| 2019 | $1,926 | $25,900 | $1,300 | $24,600 |
| 2018 | $1,822 | $25,200 | $1,300 | $23,900 |
| 2017 | $1,836 | $25,200 | $1,300 | $23,900 |
| 2016 | $1,900 | $25,600 | $1,300 | $24,300 |
| 2015 | $1,900 | $25,200 | $2,500 | $22,700 |
| 2014 | $1,900 | $25,100 | $15,000 | $10,100 |
Source: Public Records
Map
Nearby Homes
- 6115 Lerner Way
- 6223 Beechfield Dr Unit 8
- 6232 Beechfield Dr Unit 113
- 6309 Beechfield Dr Unit 45
- 6238 Beechfield Dr Unit 116
- 6300 Beechfield Dr Unit 87
- 1700 Lockbridge Dr
- 6354 Beechfield Dr Unit 64
- 1925 Bowker Dr
- 4502 Bowline Ct
- 2702 Yachtsman Dr
- 4485 Helmsway Dr
- 2670 Brigantine Dr
- 6815 Aurelius Rd
- 1265 Roth Dr
- 5808 Orchard Ct
- 5751 Joshua St
- 4345 Keelson Dr
- 7011 Aurelius Rd
- 7061 W Bickett Blvd
- 6113 Scotmar Dr
- 6113 Scotmar Dr Unit 7
- 6111 Scotmar Dr Unit 6
- 6109 Scotmar Dr Unit 5
- 6117 Scotmar Dr Unit 9
- 6107 Scotmar Dr
- 6107 Scotmar Dr Unit 4
- 6119 Scotmar Dr Unit 10
- 6121 Scotmar Dr Unit 11
- 6105 Scotmar Dr Unit 3
- 6123 Scotmar Dr Unit 12
- 6125 Scotmar Dr
- 6125 Scotmar Dr Unit 13
- 6103 Scotmar Dr
- 6127 Scotmar Dr Unit 14
- 6101 Scotmar Dr Unit 1
- 6133 Scotmar Dr
- 6133 Scotmar Dr Unit 17
- 6135 Scotmar Dr
- 6135 Scotmar Dr Unit 18