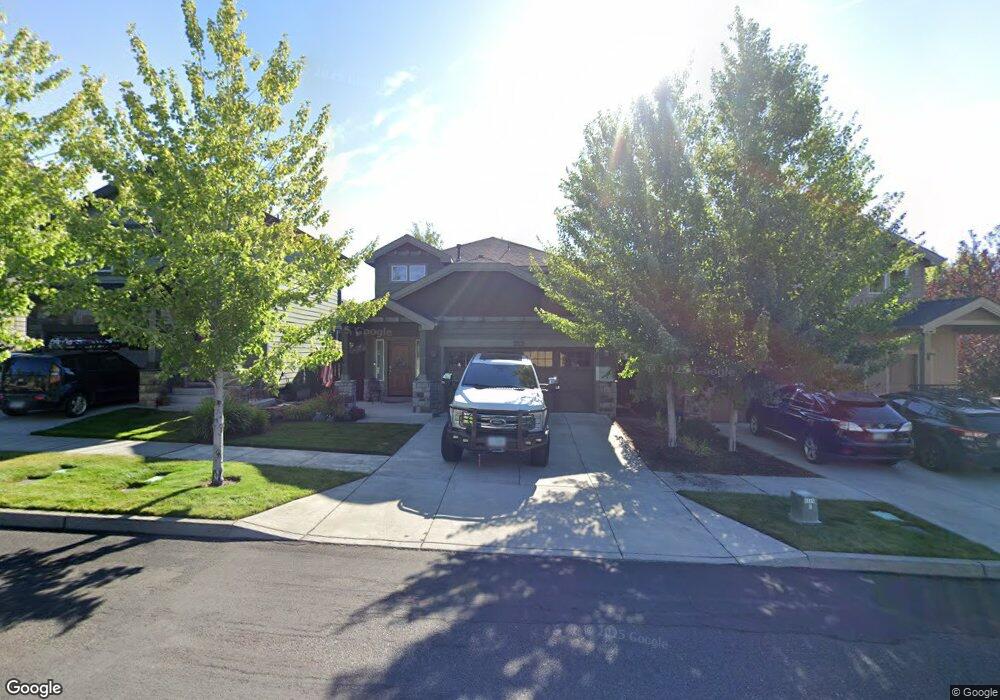
61150 Teton Ln Unit 110 Bend, OR 97702
Southwest Bend NeighborhoodEstimated Value: $644,207 - $705,000
3
Beds
3
Baths
1,941
Sq Ft
$348/Sq Ft
Est. Value
About This Home
This home is located at 61150 Teton Ln Unit 110, Bend, OR 97702 and is currently estimated at $676,052, approximately $348 per square foot. 61150 Teton Ln Unit 110 is a home located in Deschutes County with nearby schools including Pine Ridge Elementary School, Cascade Middle School, and Bend Senior High School.
Ownership History
Date
Name
Owned For
Owner Type
Purchase Details
Closed on
Jul 21, 2020
Sold by
Crown Equity Inc
Bought by
Valhalia Homes Llc
Current Estimated Value
Purchase Details
Closed on
Jun 23, 2020
Sold by
Palesch Daniel
Bought by
Crown Equity Inc
Purchase Details
Closed on
Feb 24, 2014
Sold by
Hayden Homes Llc
Bought by
Palesch Daniel
Home Financials for this Owner
Home Financials are based on the most recent Mortgage that was taken out on this home.
Original Mortgage
$260,116
Interest Rate
4.47%
Mortgage Type
New Conventional
Purchase Details
Closed on
Sep 16, 2013
Sold by
Brookswood Bend Llc
Bought by
Hayden Homes Llc
Home Financials for this Owner
Home Financials are based on the most recent Mortgage that was taken out on this home.
Original Mortgage
$6,000,000
Interest Rate
4.36%
Mortgage Type
Commercial
Create a Home Valuation Report for This Property
The Home Valuation Report is an in-depth analysis detailing your home's value as well as a comparison with similar homes in the area
Home Values in the Area
Average Home Value in this Area
Purchase History
| Date | Buyer | Sale Price | Title Company |
|---|---|---|---|
| Valhalia Homes Llc | -- | None Available | |
| Crown Equity Inc | $459,900 | Western Title & Escrow | |
| Palesch Daniel | $273,807 | Amerititle | |
| Hayden Homes Llc | $60,000 | Amerititle |
Source: Public Records
Mortgage History
| Date | Status | Borrower | Loan Amount |
|---|---|---|---|
| Previous Owner | Palesch Daniel | $260,116 | |
| Previous Owner | Hayden Homes Llc | $6,000,000 |
Source: Public Records
Tax History
| Year | Tax Paid | Tax Assessment Tax Assessment Total Assessment is a certain percentage of the fair market value that is determined by local assessors to be the total taxable value of land and additions on the property. | Land | Improvement |
|---|---|---|---|---|
| 2025 | $5,081 | $300,730 | -- | -- |
| 2024 | $4,889 | $291,980 | -- | -- |
| 2023 | $4,532 | $283,480 | $0 | $0 |
| 2022 | $4,228 | $267,220 | $0 | $0 |
| 2021 | $4,235 | $259,440 | $0 | $0 |
| 2020 | $4,018 | $259,440 | $0 | $0 |
| 2019 | $3,906 | $251,890 | $0 | $0 |
| 2018 | $3,796 | $244,560 | $0 | $0 |
| 2017 | $3,751 | $237,440 | $0 | $0 |
| 2016 | $3,580 | $230,530 | $0 | $0 |
| 2015 | $3,482 | $223,820 | $0 | $0 |
| 2014 | $1,614 | $102,010 | $0 | $0 |
Source: Public Records
Map
Nearby Homes
- 19671 Hollygrape St
- 61047 Snowberry Place
- 19694 Harvard Place
- 61041 Chamomile Place
- 19744 SW Aspen Ridge Dr
- 60924 Targee Dr
- 19666 Sunshine Way
- 19788 Chicory Ave
- 19550 Brookside Way
- 19760 Mahogany St
- 61016 Honkers Ln
- 19520 SW Century Dr
- 19525 Sugar Mill Loop
- 61299 Big Eddy Cir
- 19504 SW Century Dr
- 19555 Greatwood Loop
- 19476 SW Century Dr Unit 1 & 2
- 19476 SW Century Dr
- 61358 Huckleberry Place
- 19580 SW Century Dr
- 61150 Teton Ln
- 61154 Teton Ln Unit 109
- 61146 Teton Ln Unit 111
- 61146 Teton Ln
- 61158 Teton Ln
- 61158 Teton Ln Unit 108
- 61162 Teton Ln Unit 107
- 19618 Harvard Place Unit 113
- 19618 Harvard Place
- 19622 Harvard Place Unit 114
- 19626 Harvard Place
- 6 SW Teton Ln
- 7 SW Teton Ln
- 5 SW Teton Ln
- 3 SW Teton Ln
- 2 SW Teton Ln
- 1 SW Teton Ln
- 10 SW Teton Ln
- 9 SW Teton Ln
- 8 SW Teton Ln
Your Personal Tour Guide
Ask me questions while you tour the home.